-
 Podcast - Whose property? Greece’s housing challenges
-
 Can the Green Transition be just?
-
Podcast - How much is Greece getting out of the RRF?
-
Podcast - Between investment grade and rule of law: Greece's contrasting images
-
 Bravo, Bank of Greece
-
Podcast - A year on from Tempe train crash, trust fades as questions mount
Where is Greek growth coming from?

The current setting: In early 2024, ELSTAT published the first estimates of GDP through the fourth quarter (Q4) of 2023 and for the year as a whole. The headline number said that real GDP grew in 2023 by 2.0 percent. To many, this was a disappointment, given that the authorities had suggested that the economy was on track to grow by 2.3 or 2.4 percent.
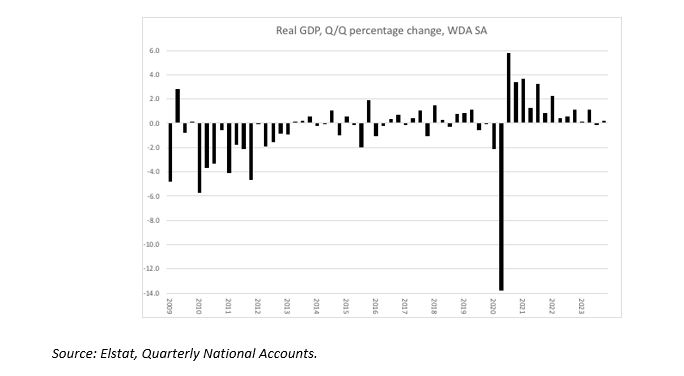
The graph below shows quarterly real GDP growth rates (seasonally and working-day adjusted data) for Q1-2009 through Q4-2023.
The graph shows three stages for the Greek economy.
1) The collapse of activity between early-2009 and mid-2013. Quarterly growth rates hit -4 percent several times, and were negative overall. A truly deep recession, as we remember.
2) Then came a period of gradual recovery, from mid-2013 to end- 2019. Growth rates were moderate, but, gradually, the economy showed progress toward more positive than negative real GDP growth numbers.
3) Lastly, covid presented a deep, V-shaped, shock. An unprecedented decline in Q2-2020 was followed by an unprecedented rebound in Q3-2020. Large subsidies and some tax relief, not just in Greece, but coordinated across the EU, helped the economy rebound quickly - Keynesian fiscal stimulus worked to avoid a new depression. Looking at the far right-hand side of this picture, this rebound from Covid seems now to have run its course. In the first, third, and fourth quarters of 2023, the economy essentially did nothing. Activity was lifted in the second quarter only. The quarterly growth rates petered out.
We can calculate what would be the growth rate for 2024 if the economy were to stay at the level of activity indicated by Q4 2023. If an economy expands gradually, activity at the end of the year will be higher than at the average of the year. This difference is an indication of the momentum with which real GDP enters the new year (2024 in this case). This number is called the “carry over” of growth from 2023 to 2024. It is presently 0.3 percent for Greece. Even if Greece were to take a breather in 2024 without further new growth, the growth rate for 2024 as a whole would still be 0.3 percent (the carry-over growth momentum). Higher growth would need to come from new growth inside 2024 itself.
What could generate new growth in 2024? Fiscal policy is limited by debt and by agreements to reinvoke the Maastricht criteria of the Growth and Stability Pact. Greece, in any event, does not have fiscal space and is phasing out some last remnants of fiscal stimulus. But, there is some support, because the EU is giving Greece, through various channels, substantial financing in the RRF and with structural funds to boost investments and strengthen potential growth in the economy. If these funds are well spent, then Greece could continue to see more growth for 2024 as a whole. The private sector on its own may also have in the pipeline some projects that come to fruition in 2024 and start generating new activity.
The Ministry of Finance, the Bank of Greece, the EU Commission, and multinational institutions and local think tanks have calculated, departing from aggregate demand models, how much Greece may spend in 2024, relative to 2023. They generally concluded that real growth could be over 2 percent, even up to 2.5 percent. I have some concerns about these numbers, but cannot rule them out based on the information so far.
The reason for my concern is that I look at aggregate supply as the growth constraint, not the availability of money to spend, which drives aggregate demand.[1] Aggregate supply can be captured by two numbers: how many new workers can Greece employ (growth in employment), and how efficient are these workers on average (labor productivity). Greece has gone through a terrific burst of employment growth since the end of Covid. This is starting to exhaust still-available labor, especially considering that the quality of remaining spare resources may not be as high as those that have already been hired (SMEs report a scarcity of qualified labor already, and demographics are adverse). If employment can grow by another 1 percent in 2024, that would be a decent result. Further, trend productivity per worker has become positive again, and my estimate suggests that it is now around 0.7 percent a year.
Putting these supply indicators together suggests that contemporaneous underlying growth may be around 1.7 percent. Going faster is possible but unlikely to be sustainable. And if productivity growth disappoints in the environment of multiple challenges that the EU and Greece face (Ukraine, Gaza, shipping disruptions, environmental warming, and political stress in the EU and Greece, to mention a few), growth could end up a bit lower.
Thus, modest expectations, coupled with a steady determination to fruitfully use the large amounts of financing and funds from the EU, and sound home-made structural reforms to chip away at supply constraints, could extend the growth path for Greece. Income per capita would increase, even under a modest outlook, given that the population continues to shrink.
Aggregate demand comparisons
Let us now compare the structure of demand in Greece with that of the partner countries in the Euro20. This may tell us more about the strengths and weaknesses of the economy. The graph below shows the share of final consumption spending in GDP in Greece and the Euro20 (solid line is Greece; dotted line is Euro20).[2]
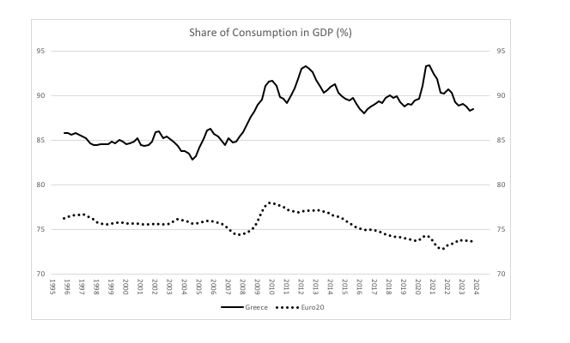
In Greece, consumption hovers around 90 percent of GDP, whereas in the Euro20 it is less than 75 percent of GDP. This also means that saving in Greece (GDP - C) is much lower than in partner countries. The increase around 2009-2010 is consistent with “consumption smoothing” —as income drops in a crisis, households try to maintain a steady consumption pattern, if financing allows it. We also see consumption smoothing in the Euro20, but this has since been reversed in favor of stronger saving and an easing of consumption. If households do not save very much, then the government has to save more to keep macro-equilibrium; but, of course, the government of Greece is not a strong saver either—hence the permanent current account deficits for the country as a whole.
There is a question that makes this graph interesting: is it possible that consumption is overestimated in Greece? Greece is a tourism country. Tourists consume a lot in hotels, bars, cafes, restaurants, resorts, etc. Is this properly identified as exports, or does this bias the final (domestic) consumption numbers upwards, as though all consumption is done by residents? In the balance of payments, we find a “balancing item” that is positive. This means that money comes in that is not recorded elsewhere. Could this be the counterpart of the income that tourists bring and spend on consumption (underreported exports)? Other tourism countries also tend to have large positive residuals in the balance of payments. This is consistent with underreporting of exports and overreporting of domestic consumption. ELSTAT and the Bank of Greece could set up a research group to assess this possibility in more detail.
The next graph shows the share of gross fixed investment in Greece and in the Euro20. The differences are once again striking: Greece spends much less than partner countries on investments. Investments collapsed in the crisis and have started to recover. At the end of 2023, there was a small downturn again, perhaps constraining the recovery.

A country with excessive consumption will have deficient saving, as mentioned above. A lack of saving will constrain investment as the pool of loanable funds is limited, and Greece will have difficulties borrowing abroad, given its debt status. Thus, here we see a structural impediment to growth that will take some time to resolve. There is some evidence that the recent uptick in investments is mostly in building/structures, but not in machinery and equipment. This mix of investment is also important for robust sustainable growth. Relative to Euro20, the two graphs reinforce the impression that Greece is supply/capacity constraint, not demand constraint.
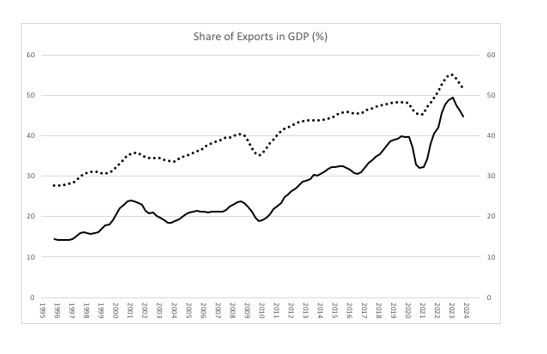
The next graph shows exports of goods and services in percent of GDP in Greece and the Euro20. It shows the unfolding development that Greece is slowly catching up with the Euro20 in exports, but still with some room to go. It is furthermore remarkable that Greece is a more closed economy than the much larger Euro20 as a whole. Normally, small countries are more open and have a larger export share than bigger comparators. This is again consistent with a supply/capacity constraint. Greece does not produce enough for bigger exports, after satisfying domestic demand. Of course, if exports are underestimated, then the assessment may change.
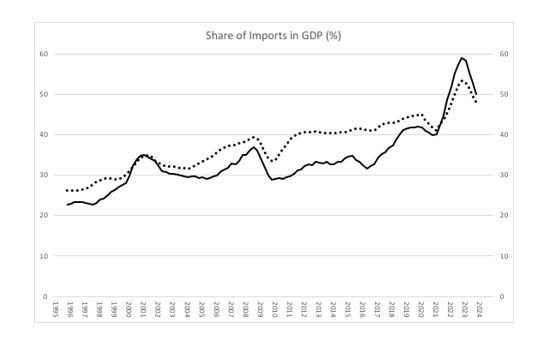
Finally, we can look at imports to GDP in Greece and the Euro20, below. Here we see that Greece imports comparatively more than partner countries (and more than it exports). Imports took quite a flight after Covid, and are easing now as the economy is slowing down. It is too early to tell whether imports are constraining growth or whether growth is slowing down and thus easing imports. But that growth and imports are so closely associated suggests that growth is not satisfied with a domestic supply response. All these angles reinforce the supply-constraint interpretation of Greece, rather than that the economy has a demand problem. Strong reforms that make the economy more competitive and less clientelist are difficult in any country. However, there is ample evidence that this is the gateway through which Greece can reach higher GDP and prosperity.
Distribution of GDP on income side
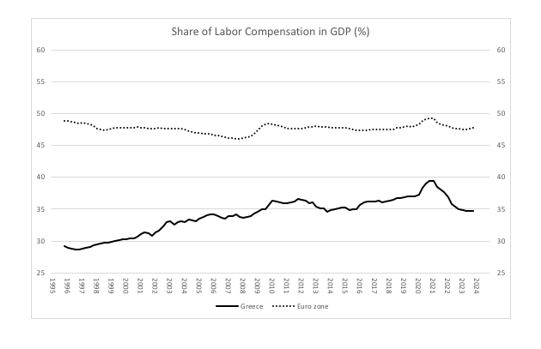
We can now look at how GDP is distributed in Greece and in the Euro20 partner countries. GDP as income is distributed between labor (remuneration), capital (operating surplus), and the government (indirect taxes minus subsidies). These data illuminate the workings of the economy and how the political system regulates activity and income.
The figure below shows the share of GDP that is distributed to labor (remuneration). In Greece, labor receives much less income than in the Euro20 as a whole. The income share had been slowly growing towards the Euro20 comparator, until the ND government came to power in 2019. The income share to labor then fell back to 35 percent in Greece, versus 48 percent of GDP in the Euro20. There are many factors at play in this distributional picture, and it would be helpful to know more about the persistent discrepancy with partner countries (structure of industries; lower productivity, etc.). I am not aware of the Greek authorities having commented on this phenomenon, or explained what may be behind it, and what policy implications one could draw from insight and further studies.
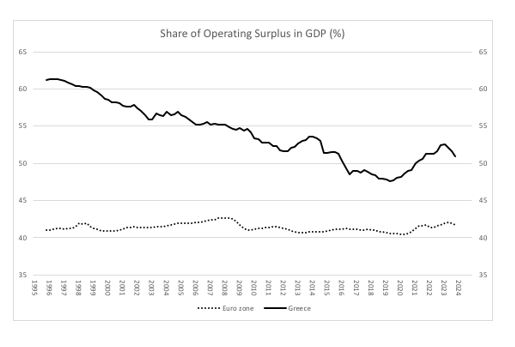
The distribution of income to capital owners (operating surplus) is shown in the chart below. We see the reverse evolution at play as with the income share to labor, above. Business owners have seen a gradual decline in profit shares over time, but this was reversed from 2019 onward. The Euro20 partners show a much smaller share of income accruing to business owners and this share is more stable over time. One difficulty that may affect the numbers in Greece is the prevalence of self-employed persons. Their income may not be truly captured under “remuneration” and hence classified as labor income. Instead, it may be swept into the operating surplus numbers below, which would overstate the return to business owners. Here, too, I am not aware of studies that explore these important and striking features of the Greek economy relative to partner countries.
The final partner receiving part of GDP is the general government, via its receipts of indirect taxes (VAT etc.) minus subsidies. The results are, again, interesting.
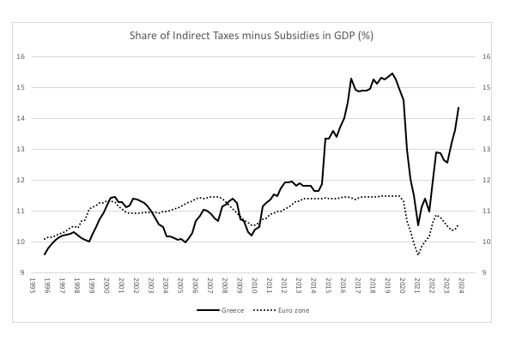
The fiscal accounts are being adjusted/tightened by increasing indirect taxes net of subsidies. Subsidies are declining all over Europe after the easing of the Covid shock. But indirect taxes are booming in Greece and not in other countries. That VAT etc. is being used as an adjustment factor to lower the deficit/strengthen the primary fiscal balance, is correct, also given the towering participation of consumption in the economy (above). However, what is striking is that New Democracy complained bitterly when Syriza first employed this instrument to achieve essentially a balanced budget in its second term in office (after Varoufakis and the referendum). It seems inelegant to say that the country is mismanaged when a party in office adjusts the deficits by collecting more VAT, and then do exactly the same when the Maastricht Criteria again come into action after Covid. From an economic point, both governments are correct to bolster the VAT and help to bring the deficit down. We can follow this story as time unfolds.
Conclusion
The rebound from Covid is slowing down and future growth rates may be more moderate than they have been in the last few years. It is important for Greece to see through the strong and welcome rebound, and keep adjusting the productive apparatus to achieve better supply response. This will make growth more sustainable and help the balance of payments, while becoming much less dependent on debt to fuel demand. The structure of aggregate demand and income distribution in Greece is largely an untold story and under-researched. The differences with partner countries remain large and striking.
*Bob Traa is a macroeconomist and author of "The Macroeconomy of Greece: Odysseus' Plan for the Long Journey Back to Debt Sustainability" published in 2020.
[1] If Greece overspends in demand, relative to supply, then it will get stuck with relatively high inflation and a large current account deficit. That was the problem in the past.
[2] All data are from Elstat and Eurostat. The time series are four-quarter moving averages (“annualized” data) of ratios to GDP.