-
 Greek firms should embrace ESG and DEI despite US-led policy reversal
-
 Podcast - Party time: Greek politics in flux ahead of next elections
-
Podcast - Brain Drain or Brain Regain? Understanding Greece’s Talent Flows
-
 The "King of the North" seeking to heal a fractured kingdom
-
 How inflation has reshaped Greek household spending
-
Podcast - Shockwaves from the Gulf: What the Iran war means for Greece
Reflections on Greece's balance of payments

The current account. We can think of GDP as income (Y) from the production and supply of goods and services: production determines “income.” On the demand side, we can distinguish four categories: consumption (C), investment (I), exports (X), and imports (M). Thus, when demand is equal to supply: Y = C + I + X - M.
X - M describes the exports to abroad of what Greece produces in goods and services (including tourism), minus the imports from abroad of goods and services that Greece uses domestically (including energy such as crude oil and natural gas). The balance X - M is called the “foreign balance.” This is the national accounts counterpart of the “current account” in the balance of payments.[1]
We can also say that Y - C = S: income minus consumption equals “savings” in the economy. Thus, we can now write that S = I + X - M, or: S - I = X - M. The saving-investment balance equals the foreign balance. In balance of payment speak: the saving-investment balance equals the external current account. If Greece saves more than it invests (S-I>0), then there are resources left over for net exports (X-M>0). How does such a development emerge in reality? Well, either production (Q) speeds up (the supply of goods and services expands, generating more income (Y)); or consumption and/or investment slow down (demand slows).
The balance of payments may not be intuitive to a broad public, but the examples above provide entry into this material. The balance of payments tells us what is happening in the economy, including how the government handles economic policy (as we will see). In fact, the balance of payments is so important in what it can tell us about the economy and policy, that, in 1945, a multilateral institution was created to study specifically all matters related to the balance of payments. This institution was called the “International Monetary Fund.”
Figure 1 below shows the current account of the balance of payments (BOP) in percent of GDP for Greece and the combined other 18 member countries of the euro area. We have taken the euro area as a whole because that avoids bringing in a further complicating element, which is that relations between countries in the BOP can be influenced by exchange rate movements. Since all 19 euro area countries use the same currency, there is no exchange rate factor that distinguishes one member from another. All face the same exchange rate.
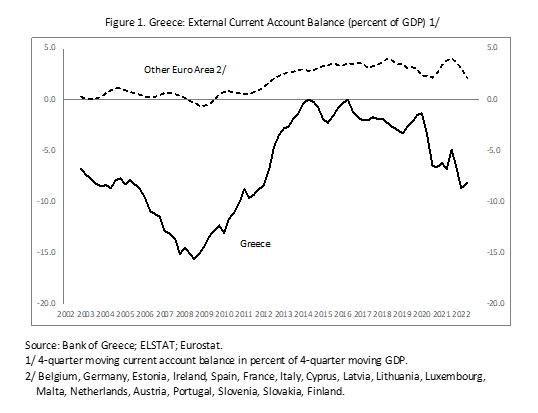
The data presented are measured quarterly. We compute a moving sum of four quarters for the current account and for GDP, so that each measurement reflects an annual total—we track an annualized current account in percent of annualized GDP.
Figure one highlights a striking feature: Greece has never had a current account surplus! Spending always exceeds income. The deficit has varied from nearly 16 percent of GDP in 2008 to touching balance (0) in 2014 and 2016. The current account has since moved to a deficit of 8.5 percent of GDP, again (data through 2022-Q2).
The other countries of the euro area have saved some of their income. Before the Great Recession in 2009-2010, their current account hovered around balance; thereafter, it has been in surplus, recently around 2.5 percent of GDP.
There is dispersion within the overall group of all 19 euro area countries. When measured as a percentage of GDP, the two big savers are Germany and the Netherlands; the two big spenders are Greece and Cyprus. Measured in euros, the two big surplus countries are Germany and the Netherlands; the two big deficit countries are Spain and Greece. Since early 2022, all euro area countries are seeing a drop in their current account positions because of the common energy import price shocks following Russia’s invasion of Ukraine. The euro area is dependent on energy imports.
To a trained eye, the current account graph of a country is like an electrocardiogram of a person. For Greece, in the early 2000s, the mood of the people was buoyant after entry into the euro area brought cheap financing from abroad, Greece won the European Football Tournament, and organized the Summer Olympics in Athens, both in 2004. Greece spent more than it earned. Income minus consumption was negative; savings collapsed and the current account took a deep dive, financed with foreign debt. This ended in 2009 when the funding stopped with the onset of the Great Recession.
Then, between 2009 and 2014, Greece experienced the painful effects of adjustment. What many branded with the dreaded word “austerity,” was in reality an inevitable “Act of Nature” when you literally run out of money. The Troika of the euro area partner countries, the ECB, and the IMF helped Greece with unprecedented funding to pass through the wringer of recovering the country’s saving-investment balance.
How did the Greek external current account adjust? In about 5 years, the current account adjusted by almost 16 percent of GDP as exports increased and imports dropped. This turnaround combined a collapse in investment of 12 percentage points of GDP (mostly in the private sector), with a recovery in savings of 4 percentage points of GDP (mostly in government).
As the funding for very large current account deficits suddenly dried up in late 2008, Greece had no choice but to cut back spending. This caused the sense of “austerity.” The country felt as though it was “adjusting through poverty.” Could this have been avoided and could the strengthening of the current account have been achieved in a different way to avoid the stresses and controversies of austerity?
Yes, on paper, namely by jumping income. With constant spending (no austerity), a sudden lift in income would have raised saving and boosted the saving-investment balance. But raising income would have required a tremendous jump in exports. In turn, such a jump in exports would have required a sudden re-engineering of the entire economy toward exportables. This would have required an improvement in competitiveness, and instantaneous massive reforms in areas such as labour, services and products markets.
Structural reform is difficult and contentious in any country; improving competitiveness takes time. Thus, given the evaporation of funding for external deficits, that reforms take time, and, importantly, the tremendous hole that the current account was in (-16 percent of GDP!), Greece had no choice but to cut spending. There was no escaping the mathematics of this problem. Mathematics represents Nature, and no-one can mess with Nature, not even the Troika.
After the dust settled in 2014-2016, Greece has once again gradually crept back into a current account hole of 8 percent of GDP. This is the result of policy. If a sudden financing stop were to recur, would Greece feel any different from the last episode of adjusting its external deficit?
Government policy. We can depict the saving-investment balance for the country as a whole, the current account, as comprising the saving-investment balance of the private sector and the saving-investment balance of the government (the public sector). Figure 2 below shows the results.
The solid line repeats the current account balance from Figure 1. The dashed line shows the government saving-investment balance, and the dotted line shows the private sector saving-investment balance. Summary numbers are helpful: the average current account deficit is -6.7 percent of GDP. The average private-sector saving-investment balance is -0.1 percent of GDP (essentially balanced over time). The average government saving-investment balance is -6.6 percent of GDP. The current account deficit of Greece reflects fiscal policy.
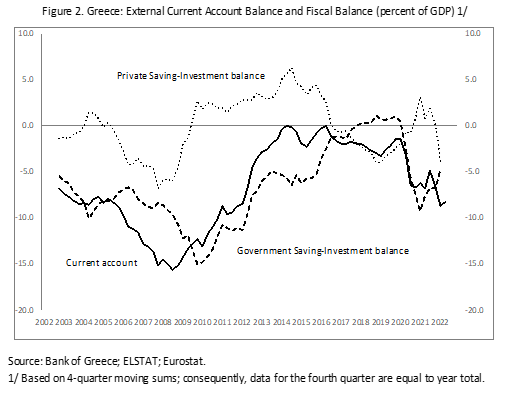
Fiscal policy in Greece has a sustained tendency to generate deficits over time (except in 2018-2019). Income is cut by granting tax cuts. Consumption is increased by hiring many people in the public sector and expanding the purchases of goods and services. Relative to the ability of Greece to generate income (related to structural reforms and competitiveness), the public sector constantly overspends. This fiscal deficit then becomes a current account deficit. Greece has nearly a perfect mapping from fiscal policy to the balance of payments: the twin deficits which also triggered the crisis in 2009.
During the Greek crisis years, the fiscal balance in cyclically-adjusted terms, was reduced by an estimated 16 percent of GDP (equal to the elimination of the current account deficit, as noted above). This is mirrored in the saving-investment balance of the government in Figure 2.
Financing the current account deficits. When a country runs a current account deficit, meaning that it imports more than it exports, how is such a deficit financed? This information, too, is shown in the balance of payments. The negative current account deficit is offset by a positive capital and financial account surplus and, if relevant, any movement in official country reserves.
There are three financing components in the balance of payments: a drawdown of official reserves; receiving foreign direct investment; placing sovereign bonds and loans (foreign debt). The annual flows of these components accumulate stocks of assets and liabilities abroad. The overall position with the rest of the world is the “net international investment position” or NII.
It is not easy to keep track of the transactions with abroad, but Eurostat receives data from member countries’ central banks. In 2008-Q1, the “restricted” Greek NII position[2] was a deficit of €-160 billion, or -68 percent of GDP. By 2022-Q2, this had grown to €-263 billion, or -133 percent of GDP. Because of continuous external deficits, Greece doubled its net liabilities, in percent of GDP, to the rest of the world.
Alternatively, we can infer an “unrestricted” estimate of the Greek NII position by adding up three subcategories reported separately by Eurostat:[3] the net foreign direct investment position, the net portfolio position, and the net “other” position.
· The net FDI position demonstrates FDI by Greek residents abroad minus FDI from abroad into Greece. The 2022-Q1 net FDI position was €-30 billion (net liabilities).
· The net portfolio position records holdings of foreign investment securities (mainly bonds and stocks) by Greek residents minus holdings of Greek investment securities by foreign residents. The 2022-Q2 net portfolio position was €154 billion (net assets).
· The net “other” position records loans and other obligations to foreigners held by Greek residents minus loans and other obligations to Greece held by nonresidents. The 2022-Q2 net “other” position was €-447 billion (net liabilities).
These three components add up to an “unrestricted” net liability of €-323 billion in 2022-Q2, or -164 percent of GDP (larger than the “restricted” definition of the NII used by Eurostat). For comparison, some euro area countries have positive NII positions (including Germany, Netherlands, Finland, and Belgium), which means that they own more assets abroad than they owe to abroad (associated with current account surpluses).
Lastly, Greece has moved from a small deficit in the net portfolio position to a surplus, and from a small deficit to a large deficit in the “other” position. This has a clear explanation: the Greek foreign debt was issued until around 2010 mainly in the form of bonds. Then, as Greece was cut off from the bond markets, partner countries and multilaterals funded Greece with rescue loans, which were used by Greece to amortize bonds. The large debt restructuring in 2011-2012 also cut the amount of bonded debt outstanding with abroad (public and private creditors).
Conclusions:
· Greece runs frequent and large current account deficits
· Excess spending reflects government deficits; the private sector is generally in balance
· The deficits are creating a growing stock of net liabilities to abroad
· Net liabilities were substantially switched from bonds to loans (from partner countries)
· Once again, Greece is building up vulnerabilities to a sudden stop of foreign funding
· Relative to income generated in the Greek economy, fiscal deficits are excessive
[1] The foreign balance and the current account are not exactly the same, because the latter also records certain income flows and grants that are not in the foreign balance, but we need not worry about that difference for this blog.
[2] Eurostat measures its version of the NII as excluding “non-defaultable instruments.”
[3] This measure should, in principle, include the “non-defaultable instruments.”