-
 Greek firms should embrace ESG and DEI despite US-led policy reversal
-
 Podcast - Party time: Greek politics in flux ahead of next elections
-
Podcast - Brain Drain or Brain Regain? Understanding Greece’s Talent Flows
-
 The "King of the North" seeking to heal a fractured kingdom
-
 How inflation has reshaped Greek household spending
-
Podcast - Shockwaves from the Gulf: What the Iran war means for Greece
Productivity developments in the Greek public and private sector

In Blog 5 for Macropolis, we demonstrated that in Greece the government employment trend, in relative terms, is outstripping the hiring trend in the private sector almost irrespective of the economic cycle. We also proposed that productivity growth in the public sector is below that in the private sector. We therefore suggested that if a resumption of economic growth and boosting labor productivity to lift per-capita income is important for Greece, then these trends would need to be reversed.
What we had not yet demonstrated to our readers is evidence that productivity growth in the public sector is lower than productivity growth in the private sector. This blog aims to fill this gap in our line of argument.
Measuring productivity and productivity growth in the government sector is not a straightforward exercise. Among the reasons is that the government sector plays a supportive role in economic development that is not measurable on the basis of contested markets where quality, prices, and volumes sort out who is more or less efficient. There is only one government in each country. There is no contested market for government services (at least not in the short run[1]). The government does many things that help the private sector, but for which it does not charge a user fee or prices related to quality in any sense. Private companies compete with one-another on the basis of quality and prices and volumes all the time, hence measuring private sector efficiency and productivity is somewhat easier.
Fortunately, we have at least one avenue for looking at productivity in the private and public sectors on a comparable basis, and that is the national accounts. The national accounts of each country compile data to measure the gross domestic product, or GDP, at constant and current prices. Real GDP is measured from the “production side,” which means that the statistical office collects data based on a sectoral basis. These sectors can be divided into those that are private, such as agriculture, mining, manufacturing, many private services, etc., and public or, government. The government sector would comprise public administration, many health activities, and most education activities—this is standard accounting applied in all countries.
When statisticians compile the national accounts as just described, they measure first “gross value added.” Gross value added corresponds to how all the value produced in the economy is distributed in the form of labor income and capital income (or gross profits). Gross value added is then complemented by two smaller items, called indirect taxes and subsidies, to arrive at gross domestic product (GDP). Thus, there is only a small difference between gross value added (GVA) and gross domestic product (GDP) and this difference tends to be fairly stable. The growth rate in GVA and GDP are virtually identical over longer time periods. If we want to boost real GDP, we have to boost real GVA. Real GVA is available per quarter and per sector, so we can calculate quarterly GVA in real terms for the private and the public sector. This is not exactly the same, but comes very close to, measuring real GDP for the private and public sector.
The quarterly labor market survey, in turn, calculates how many persons work in the sectors of the economy, including allowing us to identify how many work in the private and the public sector (what blog 5 was all about). The combination of these two pieces of information, real GVA and the number of employees, allows us to compute the production per employee—that is productivity per person employed. Countries that are efficient and effective in organizing economic life have high productivity per person employed (the level of productivity) and also have sound growth rates in this variable (productivity improves at a healthy rate, on average, due to good education, technological progress, and efficient and equitable governance).
While productivity based on the national accounts and labor market surveys are not the only indicator that can tell us something about sectoral productivity performance, these comparable numbers are widely used to enter into the study of productivity. Governments that conduct “results-oriented monitoring” often start their self-evaluation by tracking their own productivity based on GVA produced per government employee.[2] These data can then be complemented by a dashboard of other comparative indicators such as:
- what is the wage bill in percent of GDP relative to partner countries;
- how fast does government employment grow relative to output growth;
- what do surveys tells us about the satisfaction of citizens with government services;
- are people leaving our country and what is their motivation?
We have compiled the quarterly data by Elstat for the Greek national accounts by sector from Q1 2001 through Q4-2020—real GVA by sector, and the quarterly employment data from the labor market surveys, also by sector. The resulting productivity numbers of real GVA per employee are shown in Figure 1 (index Q1 2001 = 100), together with their underlying trend.
- Productivity for the whole economy is shown by the solid middle line, clearly showing quarterly seasonality (productivity in the summer period (Q3) is always the highest).
- Productivity for the private sector is shown by the top dashed line, indicating that private sector productivity is always higher in level than total economy productivity.
- Productivity levels for the public sector are shown by the lower dotted line.
- Whole economy productivity levels are closer to the private than the public sector because the private sector is bigger (has more weight) than the public sector.
- The smooth lines in each of the “toothed” indicator lines is the underlying trend line.
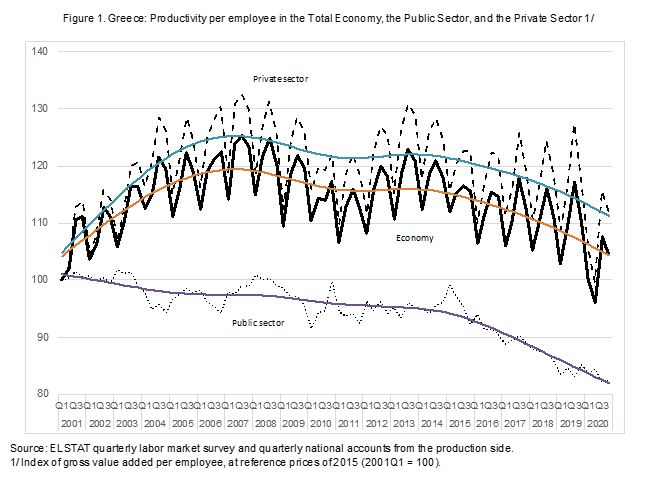
Some results of Figure 1 jump out immediately.
- Overall productivity increased in the initial boom years after euro adoption but faltered in the Great Recession and the Euro Crisis. Then, it started a tentative recovery in 2013/2014, but this was aborted around 2014/2015, and has declined since.
- For the whole period 2001-2020 (end-to-end), productivity in Greece has almost not changed.
- The private sector responds to the economic cycle and has done somewhat better than the overall economy.
- The public sector shows a consistent decline in productivity levels, especially since 2015. The latter should not surprise us too much. Syriza took over government in 2015 with the electoral promise to increase employment in government even though economic growth was still weak. The ND government in office since July 2019 has continued this policy (see our Blog 5, May 2021) .
We can look into these numbers with more detail by examining also the productivity growth figures for each quarter per sector relative to the same quarter of a year earlier (to avoid seasonality). Figure 2 shows the growth rates for the economy as a whole. The Greek economy was severely hit in the early stages of the euro crisis, and again suffered declining productivity performance from 2015 onward. The trend growth rate turned negative again in Q2 2014 and has accelerated its decline in 2019 and 2020.
Some of this latter result is related to the new shock of Covid in 2020. We need to wait for the post-Covid period to see if productivity growth for the economy as a whole will be restored. Since it was explicit government policy to keep people on the payroll during the Covid recession, productivity suffered dramatic declines. But the trend line highlights that the downward trajectory started years before Covid-19 struck.
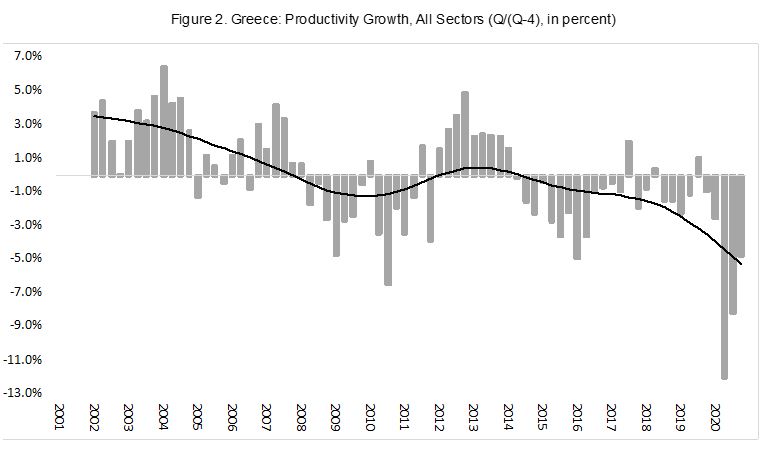
Figure 3 shows the results for the private sector in isolation. These data show similar trends as for the economy as a whole, but generally with slightly higher (better) numbers. The incipient recovery in 2012/2013 was quite strong, but faltered again in 2014 and beyond.

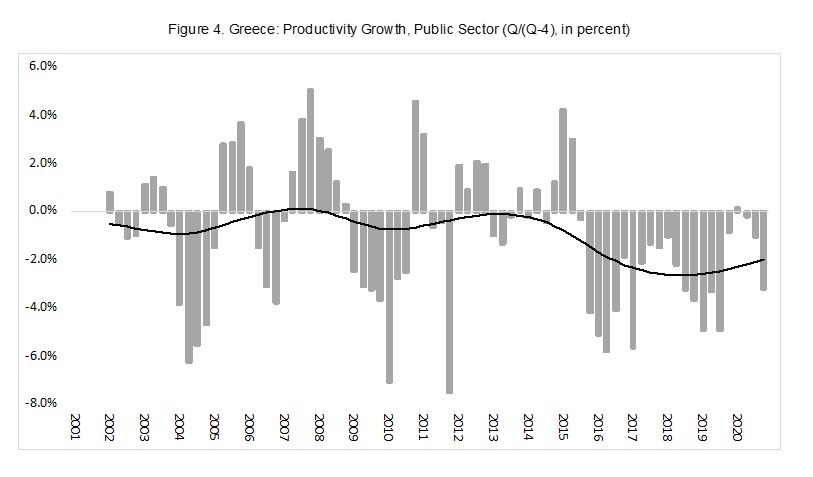
Figure 4 shows the same calculations for the Greek public sector (general government). These numbers show that the Greek government, on trend, almost never shows positive productivity growth—hiring almost always outstrips the production of real GVA by government as measured in the national accounts to compute real GDP. The hiring booms in 2004 and 2006 once again appear in the data. Efforts to slow hiring in government and restore productivity during the euro crisis in 2010-2014 are also visible, but the hiring boom following 2015 once again depressed productivity growth to substantially negative numbers. Since 2019, some effort was made to improve productivity growth in the public sector, but Covid-19 presents a new external shock that will take some time to overcome.
Some readers find it easier to absorb information through a table, rather than looking at a graph, so we have summarized the results in Table 1 below. In this table, we compute the compounded growth rate in productivity from Q1 2001 through Q1 2020 (to avoid the Covid-19 shock), translated to an annualized basis. We also computed the results for the sub-period 2001-2009 (prior to the euro crisis) and since then (but not including Covid-19 for the period Q2-Q4 2020).
What these calculations suggest is that for the whole two decades period, the Greek economy had virtually no productivity growth, including the before and after euro crisis episodes. Before the euro crisis, the private sector produced productivity growth of 1.5 percent a year, which is a good result. But, even during the boom years, the public sector returned negative productivity growth. Since the euro crisis, even the private sector has struggled to regain productivity growth momentum, while the public sector faltered even further in Greece.

What the data suggest to us is that the Greek government clearly has much lower productivity performance than the private sector. If Greece wants to restore output growth and per-capita growth, then accelerating employment in the public sector is not the way to go; releasing labor resources to the private sector is more productive. But even the private sector needs reforms to increase its own capacity for productivity and productivity growth.[3] These reforms are as important in the product markets as they are in the labor markets. Greece has done some labor market reforms, but has fallen short on product market reforms.
Reforms in government to boost productivity and productivity growth need to begin by improving efficiency and restraining the growth in government employment. If this is not an explicit political objective, and if this is not continuously monitored through results-oriented-monitoring, then this aspiration will almost certainly be left unmet. Consequently, as the data provided and our blog illustrate, the Greek economy will then continue to struggle with subpar performance.
*Bob Traa is a macroeconomist and author of "The Macroeconomy of Greece: Odysseus' Plan for the Long Journey Back to Debt Sustainability" published in 2020. Jens Bastian is senior policy advisor at ELIAMEP.
[1] Governments do compete, in some sense, against each other, especially in unions such as the European Union or the United States of America that create freedom of capital and labor movement. In such markets, if the public loses confidence in the efficacy of its own (regional or state) government, the public can “vote with its feet” and move to other territories. There is ample evidence that (young educated) Greeks are leaving Greece for other countries in the EU. Surveys also suggest that many Greeks are unhappy with the performance of the political system. This is a wakeup call for Greek politics—emigration is endogenous.
[2] For instance, Statistics Denmark published a series of annual reports such as: “General Government Output and Productivity 2001-2008,” wherein it assesses government productivity using real GVA and other indicators. These helpful reports include international comparison, and discuss technical challenges in measuring government productivity.
[3] The Pissarides Report (led by Nobel Laureate Sir Christopher Pissarides 2020) commissioned by the Greek government in 2019 and published in November 2020 identifies these productivity challenges. It remains to be seen in practice if the country will act on its recommendations.