-
 Greek firms should embrace ESG and DEI despite US-led policy reversal
-
 Podcast - Party time: Greek politics in flux ahead of next elections
-
Podcast - Brain Drain or Brain Regain? Understanding Greece’s Talent Flows
-
 The "King of the North" seeking to heal a fractured kingdom
-
 How inflation has reshaped Greek household spending
-
Podcast - Shockwaves from the Gulf: What the Iran war means for Greece
Greek fiscal deficits and debt since 2000

In our November 2021 Blog 11 we demonstrated, based on data in the general government bulletin of the Hellenic Ministry of Finance, that the Syriza 2 government (from September 2015 to July 2019) essentially ran a balanced budget rule. This good fiscal performance earned Greece an exit from the third macro-economic adjustment program in August 2018.
Our concluding monthly Blog 12 in 2021 explores whether balanced budgets also means that the debt remains constant in nominal terms? The answer to this question is important because if budget balance could mean that debt still increases, then this alone is not enough to come to terms with Greece’s debt challenge.
As an example, let us again take a look at Syriza 2. This administration ran an average overall surplus of 0.1 percent of GDP a year. Running a surplus should mean that the debt stock declines, certainly in percent of GDP, provided that the economy is growing. But the stock of debt during Syriza 2 increased by some €19 billion, or almost 4 percentage points of GDP!
This difference between the overall balance and the variation in the stock of debt is called the “stock-flow discrepancy.” The debt is a stock of accumulated deficits from the past, and the fiscal balance is an annual flow that adds or subtracts from the debt. The key to the stock-flow discrepancy is that there are some government operations that are neither classified as revenue nor expenditure, and do not affect the fiscal balance, but they can affect the debt.
Again, Syriza 2 is a good example for this dynamic. To exit the third program, Greece would need to return to international capital markets to finance future deficits or roll over maturing debt. Capital markets are more willing to lend to governments if these have healthy cash cushions to meet prospective debt service payments. Strong liquidity in the government’s finances improves debt service confidence, whereby interest costs will be lower, and rolling over existing debt will be easier. But Greek governments tended not to have much cash on hand. Instead, there were continuous problems of arrears in payments. So how could Greece still exit safely from the program in 2018?
The solution was to borrow cash from the European Stability Mechanism (ESM) and deposit this in the bank to secure confidence in future debt servicing ability. This operation increased deposits and debt volumes at the same time, but it was neither a deficit nor a surplus, because it was not related to revenue or expenditure. Issuing debt to bolster liquidity is an example why a stock-flow discrepancy can occur. There are other operations (Table 1 below) that can change the stock of debt without affecting the fiscal balance. In short, assessing public finance performance and the economic health of the state is not just a matter of the fiscal balance. We must look at all operations and effects that change overall debt and, beyond debt, the state’s net worth.[1]
Data in the general government bulletin is compiled on a so-called “modified cash basis.” This means that the ministry of finance uses the internal budget monitoring system, which records most operations when cash changes hands (when revenues are paid in and expenditures are paid out). These data are supplemented with information from the Central Bank and other institutions, including some operations that were committed to, but have not yet resulted in cash flows. Combining cash and non-cash data gives rise to the term “modified cash basis.”
The European Union measures the general government fiscal operations on a “commitment basis” as agreed by all member countries in the European System of Accounts (ESA). This means that the moment that cash changes hands is not the relevant indicator for an expenditure or a revenue. Rather, commitment basis records the moment that the general government engages in a commitment to spend or receive. Sometimes, a commitment to spend is made but the cash operation to settle this expenditure comes only later.[2] Thus, there are differences of leads and lags between the Bulletin numbers and the ESA numbers. ELSTAT compiles the ESA numbers based on independent sources and surveys and submits the results to Eurostat in Brussels.
Governments and statistical offices of all EU member countries are constantly talking to one-another and to Eurostat to agree on what operations, and when, go into the calculation of the ESA accounts, because these are the comparable accounts that are subject to the measurement of the so-called 3 percent deficit rule and the 60 percent debt rule of the Maastricht criteria.
Thus, it is important to realize that the bulletin numbers of the Ministry of Finance are not the same as the ESA accounts. However, in tranquil times, the differences tend to be small, and the monthly data from the general government bulletin will give us a good indication where the ESA numbers, which are only presented on a quarterly basis with some lag, will come out. For example, the annual deficit for 2013 in the bulletin was €7 billion, whereas the final ESA number for that same year was €24 billion—a huge difference. Over time, these differences have shrunk, and for 2020, the bulletin records a deficit of €16.1 billion whereas the ESA number was €16.7 billion. During the second Syriza government, the bulletin recorded a surplus of €6.7 billion and the ESA accounts a surplus of €5.2 billion. Thus, the good Syriza 2 results were confirmed by the ESA accounts; they were not a result of domestic accounting.
The reason we mention these differences is that to analyze the stock-flow discrepancy, we only have fully consistent numbers from the ESA accounts. The Ministry of Finance does not present a stock-flow discrepancy analysis of its numbers in the bulletin. But, Eurostat publishes on its website a detailed breakdown of why the ESA deficit numbers sometimes do not correspond with the variation in the debt. If we can explain this discrepancy, then confidence in the fiscal data improves. That is an important objective when informing the citizens about the financial health of the state. So, let us look at this stock-flow discrepancy for Greece in the ESA accounts for the period 2000-2020 to see if these numbers tell us a plausible story.
Table 1 summarizes Eurostat’s Greek stock-flow reconciliation. We present groups of 5-year data; the original version is annual. The top line shows the stock of gross debt as defined in the Maastricht criterion. It shows that the debt increased from €148 billion in 2000 to €341 billion in 2020; an increase of €193 billion. From 2000-2010 the debt increased by a whopping €182 billion. In the decade of the programs from 2010-2020, the debt increased by 11 billion. How do these developments relate to fiscal policy and budget balances?
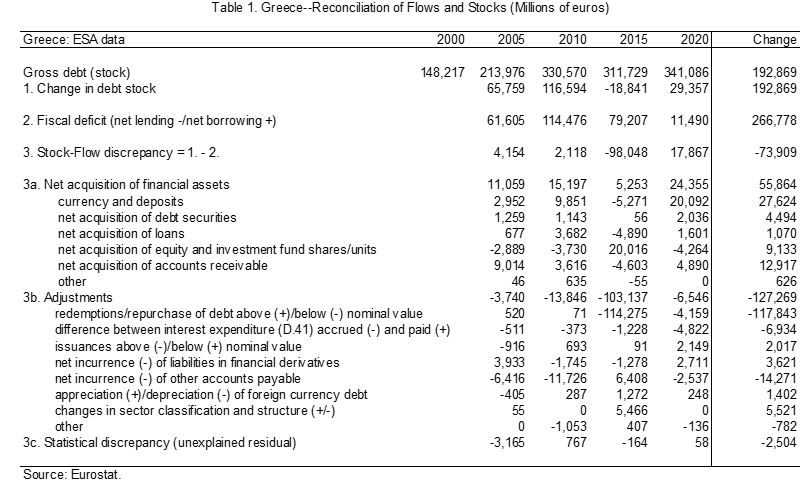
Line 2. presents the flows of deficits (fiscal policy) during each 5-year period and the total. Greece ran a cumulative deficit of €267 billion over the period 2000-2020. The biggest deficits were accumulated during the period 2000-2010 of some €176 billion; the decade thereafter saw deficits of €91 billion during the programs. The discrepancy between the increase in the stock of debt and the cumulative flows of all the deficits is €-74 billion (Line 3). The debt went up much less than the sum of the deficits. How did this happen?
The short answer is that the rest of the world, both private sector and euro partner countries combined, forgave Greece a huge amount of debt (wrote it off) in different debt restructuring operations and allowed Greece to swap sovereign obligations below the value of the original debt incurred. In line 3b. called “adjustments,” we see that Greece received €118 billion in debt forgiveness. To the best of our knowledge, this is the biggest debt write-off in history to date.
Further, Greece was allowed to pay less interest than it would have to (deferred interest). This provides another €7 billion in debt relief over the entire period. The other big adjustment is accounts payable, but this is nearly offset by the counterpart of accounts receivable in Line 3a. and is therefore somewhat less relevant for our present purposes in net terms.[3]
What matters is that Greece received downward adjustments to its debt of €-127 billion; a huge amount that stands out in comparison with any partner country in the euro area. It is this (broadly speaking) debt forgiveness that helped Greece keep the overall debt increase down as compared to its enormous accumulation of annual deficits. Without this forgiveness, Greece would have had to default on the debt and that would have generated a much bigger and disorderly collapse in the country and possibly also in the euro area.
Greece also incurred financial operations that increased the debt beyond the annual deficits (Line 3a.). We highlight two important factors. One is the placing of debt to increase deposits of the government that we already mentioned before. We see in the ESA analysis that this amounted to a total of €28 billion, mostly concentrated in 2015-2020 during the Syriza government. Two is the acquisition of equity shares by the central government, amounting to €9 billion in total, but with a big surge during the period of debt forgiveness in 2010-2015.
Why is this so? It is so, because when debt restructuring in 2012 (“haircut”) hit the government bonds in the portfolios of Greek banks, these financial institutions needed capital injections to survive. These capital increases were provided by the Greek government. Thus, the government received a huge debt cut, but then needed to borrow back a chunk of debt in order to recapitalize the domestic banks. In later times, the government is gradually selling/divesting its ownership of these equity shareholdings.
At the end of all this careful numbers checking, we see that only €2 billion are left (Line 3c.) that cannot be fully explained in the stock-flow reconciliation. That is a small amount by any comparison. Thus, the stock-flow reconciliation in the ESA accounts is quite an impressive feat.
We apologize for presenting so many numbers in this blog that only true hobbyists like ourselves would enjoy plowing through to discern a story behind the data. But the bottom line is this: Greece ran big deficits in the first decade of the 2000s. These were unsustainable. The stock of debt that resulted by 2020 was limited by deficit cuts and the biggest debt forgiveness in financial history. Further, the government acquired deposits and shares in banks that do not influence the deficits. All other components are more or less ups and downs that occur in many countries and in different years—they do not materially alter the result.
We can now say with some confidence that, if the government runs a balanced budget for a while, then the debt will stabilize in nominal terms (the big adjustments and asset purchases noted above will not be necessary in the future), and the debt will decline steadily in percent of GDP as the economy undergoes effective structural reforms to resume healthy growth.
We conclude that the Syriza 2 government placed Greece on this path. We are unsure whether Greece is still on this trajectory in view of the structural tax cuts, uncompensated by equivalent structural expenditure cuts, that the subsequent New Democracy government has introduced since July 2019. Covid spending is a temporary injection into the economy; this is not a structural driver of future deficits.[4]
[1] Net worth is the best summary indicator of the state’s financial health. We are not aware that Greece publishes a full balance sheet for the state, so we will restrict ourselves for now to the narrower concepts of deficits and debt.
[2] For instance, one area where the time difference between commitment to spend and settling this expenditure can be large (over a year at least) is defense and security spending, i.e. military procurement.
[3] However, arrears, which are payables overdue, keep being a problem in Greece. The government needs to resolve them as they are a mark of sloppy administration, destroy confidence, and raise the country risk premium.
[4] It is also a fact that during most of the period 2000-2010, New Democracy was in charge; and the deficits exploded, as the data show. The myth that Greek conservative governments are better financial managers is just that: a myth (the same myth also exists in the US with Republican administrations). But that is another story for another blog.