-
 Greek firms should embrace ESG and DEI despite US-led policy reversal
-
 Podcast - Party time: Greek politics in flux ahead of next elections
-
Podcast - Brain Drain or Brain Regain? Understanding Greece’s Talent Flows
-
 The "King of the North" seeking to heal a fractured kingdom
-
 How inflation has reshaped Greek household spending
-
Podcast - Shockwaves from the Gulf: What the Iran war means for Greece
The case for a general government balance sheet

Over the course of the past year we have drawn attention to the need for a general government balance sheet. One reason for this effort rests in the observation that today’s balance sheet of a government impacts future generations.
Figure 1 shows the summary results of a preliminary general government balance sheet for Greece and the 19 countries of the euro area (Euro-19).
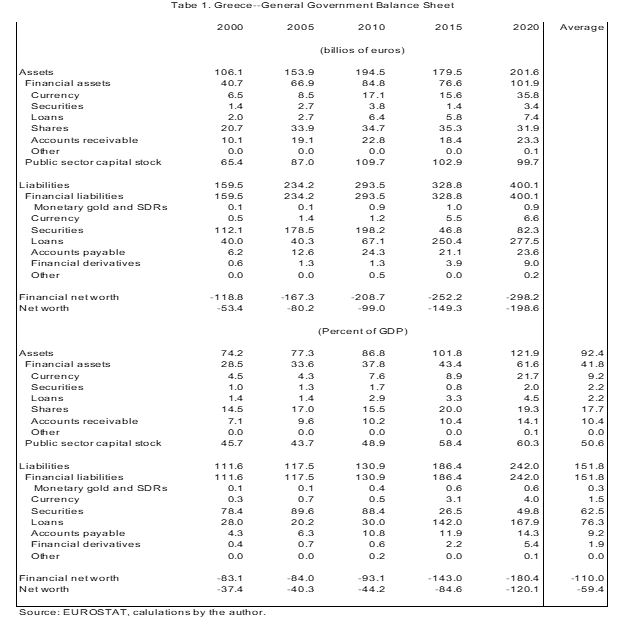
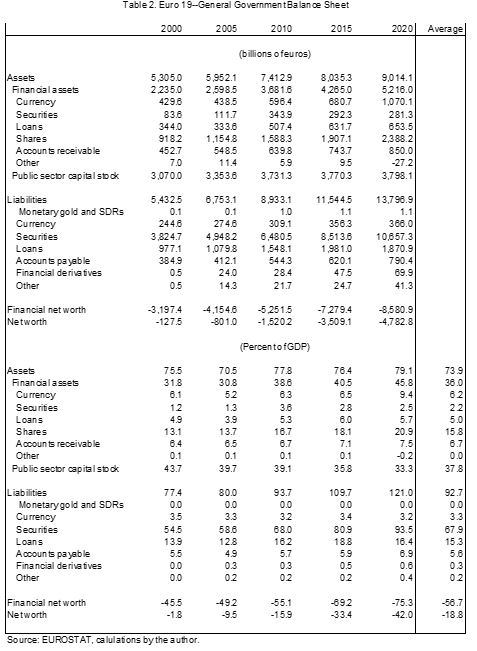
Subsequent tables 1 and 2 illustrate balance sheet data in more detail.
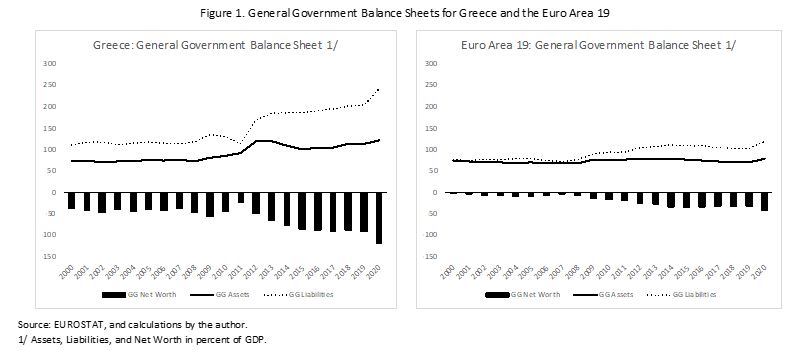
Figure 1 above captures for Greece and the Euro-19 the assets, liabilities, and net worth of the general government in percent of GDP. We can make the following remarks:
- Net worth is negative in Greece and the Euro Area; a private entity (company or household) could not survive for long with these numbers.
- Net worth for Greece at -120 percent of GDP is much deeper than the -42 percent of GDP for the Euro Area-19 as a whole (Euro-19 includes Greece).
- The deterioration in net worth is getting worse over time, meaning that policies are not sustainable as they are, lest we want to leave future generations with bankrupt states.
- The net worth of the general governments dipped with the global recession around 2010, and have now received another whack with the Covid pandemic in 2020.
- Given that aging is unfolding, and that this is a structural force for even deeper negative net worth in the future, at some point fiscal tightening will be necessary.
Has any political system that the reader is aware of discussed this dynamic of the state? Has any political system explained whether this is sustainable; and, if not, what are the options to do something about it? We suggest that the answer is: no. And a key reason is that political systems are calibrated for the next election, not the next generation. Further, these negative net worths do not include environmental degradation nor the depletion of nonrenewable resources, because they are not costed in macroeconomic models. Thus, young people have reasons to be worried.
We can now turn to a more detailed look at the balance sheets in Tables 1 and 2. The balance sheets reflect the data that are available from Eurostat for the “annual financial accounts” for general governments (GG) as submitted by all EU members; and the calculations for the nominal net capital stock as presented in our blog 13 of January 2022.
The annual financial accounts show only data on financial assets and liabilities of each general government. Included in the financial liabilities is the gross debt (according to the Maastricht criterion). The reader may verify that financial liabilities are larger than the Maastricht debts. Thus, the Maastricht rules only look at a partial corner of a government’s liabilities. They say nothing about assets nor the net worth of the state. Such an inclusive balance sheet would enable a more comprehensive reading of the financial health of a government.
Another interesting aspect is that if we split the financial liabilities into “Maastricht gross debt” and “other liabilities,” then the “other liabilities” are continuously getting bigger. This suggests that governments are finding ways to finance deficits outside the Maastricht definition of debt. This discrepancy with the Maastricht objectives is increasing over time. In short, not only are many governments not willing to stick to the 60-percent rule. They are also incrementally finding ways around the Maastricht definition of debt thereby eroding net worth further.
Voters cannot know about this erosion of government net worth without a comprehensive balance sheet. Systematically providing more information about the balance sheet of the government would make for a more informed, and interesting, political-economy debate.
Eurostat collects data on financial net worth only because it is inconceivable that governments sell their capital stock to fill a financing gap, or to address a negative net worth. Companies in financial trouble shrink and consolidate all the time, restructuring their balance sheet to regain a healthier net worth. Governments cannot sell the capital stock.
Still, we believe that reporting a balance sheet, including the results of capital allocation, is preferred because the voters need to see and understand what politicians do with their tax money. The capital budget is one of the most prone to waste and corruption in any government, so the solution is to provide more information and a comprehensive picture, not to provide only a partial overview (focusing on Maastricht debt is a very partial picture).
If we focus on the financial balance sheet only, as Eurostat does, then the financial net worth to support our governments is even worse than if we include a capital stock in the net worth. In Greece, the financial net worth is -180 percent of GDP; and in the Euro Area-19 it is -75 percent of GDP, and steadily getting worse over time in both regions.
We see that both the Greek and the euro area governments tend to increase their liquidity holdings in times of stress (proxied in the balance sheet by “currency” holdings). Around 2010 and 2020, governments issued a lot of debt to have the funds at hand to support their domestic economies. This money does not get spent at once, so the liquidity of the government is boosted. In the Euro Area-19 the average liquidity holdings are around 6 percent of GDP. This is enough to make payments on time and avoid arrears, which would be damaging to the reputation of the government and increase the country risk premium in financial markets. In Greece, the liquidity position averages 9 percent with less in the first decade of this century and more in the second.
It is noteworthy that in 2020, the Greek government holds a whopping 22 percent of GDP in liquidity. In Blogs 11 & 12 we explained that this occurred because in order to exit the programs with the Euro partner countries, Greece purchased a large cushion of deposits with debt at the ESM to keep capital markets assured of Greek debt servicing ability.
It is, however, also true that holding so much cash is inefficient and costly, because cash assets yield less than is the cost of debt. It is not clear why Greece did not opt instead for a contingent credit line from the ESM to assure capital markets. This would have saved net interest on the debt and keep the gross debt lower than it is now.
Perhaps it was felt that contingent credit is not as convincing as showing the cash in the bank. Or, it is possible that having the cash in the bank opens up spending opportunities that would have been more difficult under a contingent credit line. We do not know why the political decision was made to go for cash rather than for a contingent credit line.
In Greece, we see a marked shift from securities (mostly bonds) to loans as the key debt items. This occurred because with the Greek crisis, markets did not want to buy more Greek bonds, and the adjustment programs were mainly financed with loans from partner countries, the IMF, and the ESM. It is to be expected that the relative distribution of debt will shift back from loans to bonds in the future.
Greece sees a large increase in both accounts receivable and accounts payable, from around 5 to 14 percent of GDP on average between 2000 and 2020. That is not the case in the Euro Area-19 countries as a whole, where these entries average around 6-7 percent of GDP. Together with the continuation of arrears, this shows that financial administration in Greece has some way to go. High accounts receivable/payable are inefficient and indicative of poor administration.
We suspect that these balance sheets are quite incomplete. For instance, what is the valuation of all the land that governments tend to own? We do not believe that this is captured adequately in the “fixed capital stock” that we have computed based on available data on fixed investment spending. Thus, it is possible that the government net worth is higher (better) than indicated in these preliminary statements. But if that is so, why do citizens have no information about these “hidden assets” that are managed on their behalf by politicians?
Also, there is no disclosure, from what we can tell, on the return on investment that citizens have in the assets on the government balance sheet. Can these assets be managed in a better way that would open up space to lower the debt through a balance sheet restructuring (balance sheet “shortening,” as assets and liabilities are reduced simultaneously), ease some of the tax burden as improved asset management yields a higher return, or absorb some of the fiscal pressures that are still to come in the aging welfare societies?
The time for full accrual government balance sheets has come. The Maastricht criteria are helpful markers, as far as they go, but they leave too much information undisclosed, and too many questions unanswered.
Extension--the intertemporal government balance sheet. For a fuller reading of the plans of the political system with people’s assets, it is possible to make the balance sheet not only backward looking, as in Tables 1 & 2, but also forward looking. For instance, the government can disclose in a long-run scenario what its policies endeavor to achieve with the macroeconomy and the public finances. Such a long run scenario would disclose the government’s view on potential real and desirable nominal GDP in the future, say for the duration of the next generation (going out to 2100 or so).
Then, the government can disclose its view on what such a macroeconomic scenario would imply for sustainable fiscal balances and debt in the future. This future path of fiscal balances (the primary fiscal balances, to be precise) can then be discounted at the government’s envisioned average interest rate on the debt. This discounted stream of future primary balances reflects the net present value (NPV) of future surpluses and/or deficits; and that NPV can be added to the existing (back-ward) looking balance sheet to include a dynamic forward-looking component, so as to make the balance sheet “intertemporal.”
An intertemporal balance sheet would show both the accumulated assets and liabilities from the past, plus the net present value of what the government has in mind with its long-run vision for the country and the debt. The intertemporal net worth is then an indicator of whether the government’s plan for the economy and public debt are compatible with a non-negative net worth. If the intertemporal net worth, so calculated, is negative, then policies would need strengthening; if the intertemporal net worth is positive, then the policies may be sustainable.
A key benefit of such disclosures would lie in the transparency toward the citizens of future government plans and their attendant credibility. Analysts of all stripe are then free to assess and evaluate the government’s long-run plans and provide possible comments and suggestions for improvement of the outcome. Participatory democracies depend on such full vetting of what different factions in politics have in mind with the people’s assets and liabilities. This is especially useful for young generations that stand to be confronted with the outcomes of government policies during their lifetime.
*Bob Traa is a macroeconomist and author of "The Macroeconomy of Greece: Odysseus' Plan for the Long Journey Back to Debt Sustainability" published in 2020. Jens Bastian is senior policy advisor at ELIAMEP.