-
 Greek firms should embrace ESG and DEI despite US-led policy reversal
-
 Podcast - Party time: Greek politics in flux ahead of next elections
-
Podcast - Brain Drain or Brain Regain? Understanding Greece’s Talent Flows
-
 The "King of the North" seeking to heal a fractured kingdom
-
 How inflation has reshaped Greek household spending
-
Podcast - Shockwaves from the Gulf: What the Iran war means for Greece
The quarterly national accounts from the income side

ELSTAT recently published the results of the national accounts through the second quarter of 2021. There is good news in these updated GDP numbers for Greece. On a seasonally and working-day-adjusted basis, the level of real GDP in Q2-2021 (€45,987 million) reached above the result of Q2-2019 (€45,972 million), the previous local peak).
This means that real GDP has now recovered from the sharp decline that was associated with Covid-19 in 2020. This V-shaped recovery for Greece is even sharper than for many EU partner countries, which are close to, but not yet above, the level of their output recorded before the pandemic hit their economies. Greece has had a large fiscal stimulus among EU partner countries.[1] This suggests three things:
1) Keynesian policies work (when the private sector pulls back, a government impulse helps to level GDP upwards); and
2) The challenge for Greece is now to make this recovery permanent because the speed and volume of government stimulus cannot be sustained forever.
3) Several partner countries had a lower fiscal impulse, accumulated less additional debt, and will take somewhat longer to recover the previous level of real GDP.
Think tanks and leading Greek banks have released briefs and updates about what these real GDP numbers mean for the near future, and what the cycle may bring, say, through end-2022. The commentary tends to be reasonably optimistic that Greece is reaching take-off velocity, and that the Covid-19 downturn is gradually being overcome.
This blog, for now, takes a more cautious view because we would like to see what happens when the fiscal stimulus wanes. Is the supply side of the Greek economy robust enough to sustain this recovery, or will there be new stress either from the debt side (which remains an unsolved problem), from an uptick in inflation which is already manifesting itself (e.g. in the energy sector), or from a renewed gapping out of the external current account surplus? This blog will focus on an aspect of the national accounts that is less talked about and is less well known to most readers. That is the presentation of the national accounts from the income side.
The level of real GDP as presented in the national accounts is typically measured from the production side. ELSTAT receives information from all sectors in the economy regarding their production in a given quarter. These numbers form the basis for real GDP from the production side (Table 1).
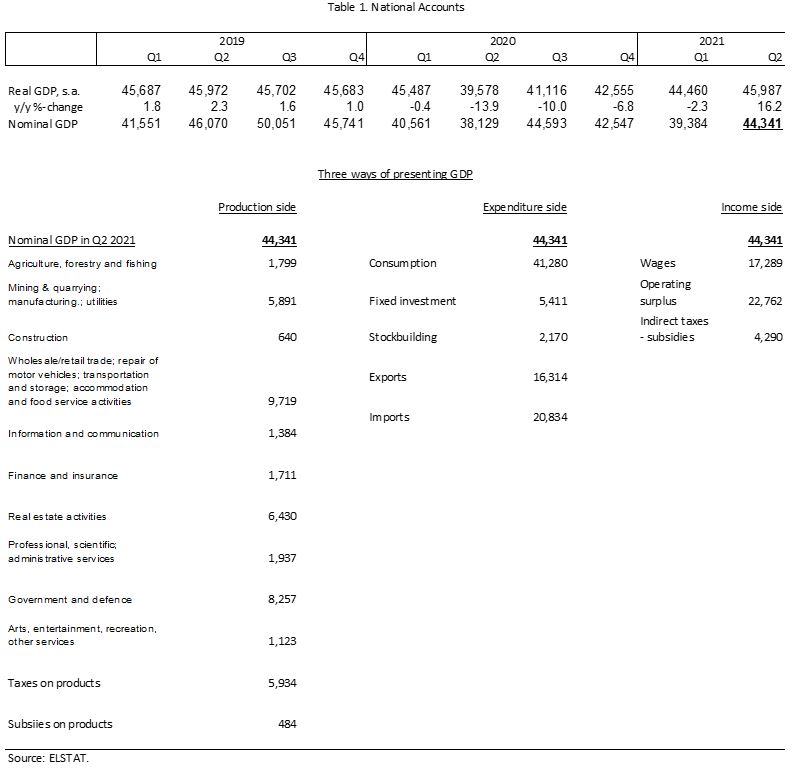
Since all the goods and services that are produced must somewhere and somehow be absorbed by consumption, investment, and (net) export demand, there is also a presentation of real GDP from the aggregate demand side (i.e. the expenditure side). Where are the goods and services used in consumption, investment (including inventory), and net exports?
There is even a third way of slicing up the GDP pie. Who receives the income that is earned in producing all this output? Part of it goes to workers in the form of labor compensation (“wages”), another part goes to the owners of capital, land, etc. in the form of operating surplus, and a third part goes to the government in the form of indirect taxes minus subsidies. That is what is labelled GDP from the income side.
All three forms of adding up GDP (supply, demand, and income; Table 1) must give the same result—an economy cannot absorb (demand) more than is produced (supply; inventory is the swing factor in demand); and income distributed from output cannot exceed the value of output itself (operating surplus is the swing factor).
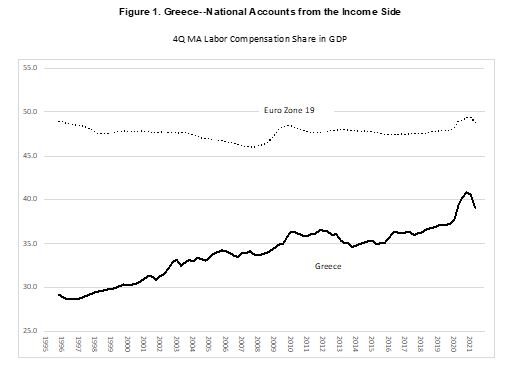
Figure 1 below shows the three components of GDP (wages, operating surplus, and indirect taxes - subsidies) from the income side for Greece and the 19 Euro zone countries. We plot the moving four-quarter average of the ratio of income components to GDP to avoid the high quarterly ups and downs that would otherwise complicate the interpretation of the results. The three shares of GDP add up to one to exhaust the distribution of GDP between “wages”, “profits”, and “government share.”
We can make some observations regarding the trends for Greece and its comparator, the Eurozone 19:
- Wages (Figure 1a) have taken up a smaller share of income in Greece as compared with the euro-zone partners. The wage share has been around 34 percent in Greece (but growing) and around 48 percent (relatively stable) in the average euro-zone country.
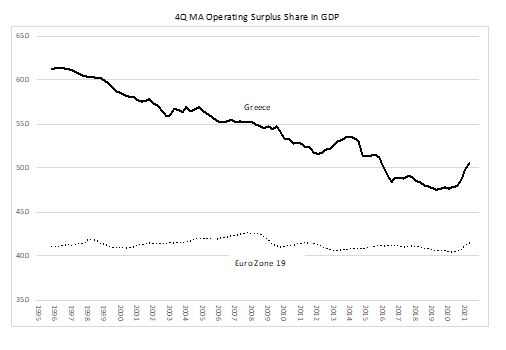
- Operating profits (Figure 1b) in Greece have been higher than in the euro-zone countries: around 54 percent in Greece (but falling) and around 41 percent (relatively stable) in the euro-zone average.
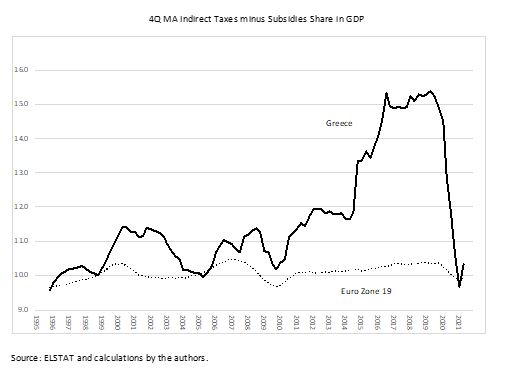
- The receipt of indirect taxes minus subsidies (Figure 1c) accruing to the government out of GDP has averaged around 12 percent in Greece (quite volatile) and around 10 percent in the euro-zone average.
- The differences in the wage share and the profit share in Greece and the euro-zone average are shrinking. Gradually, Greece seems to be evolving toward the euro-zone average. A simple extrapolation of trends suggests that, at the recent pace, it will take 20 years up to around 2040 for the wage share in Greece to converge with the experience in the euro-zone average.
Following these observations an interesting question emerges: why are the wage and profit shares so different in Greece and in the euro-zone average? One explanation will have to do with structural factors and market power. Domestic competition in Greece in output markets has been relatively weak. Companies enjoyed clientele-type protections from government policies; operated in ring-fenced (closed) markets; and were able to extract above normal profits. The philosophy of “structural reforms” and enhancing open market competition inside Greece by the Troika (2011-2015) and, thereafter, by The Institutions, was of course directed frontally at this problem. Alas, there is progress, but it remains a struggle.
Further, the “self-employed” in Greece have always known that if you set yourself up as a proprietary business, then, in such a system, you have certain advantages and benefits. That is why Greece has so many “self-employed” workers. The return from these self-employed workers is mostly captured by the category “operating profits” as a residual “other income” because their income is not measured as “wages” or labor compensation. This distortion in the Greek market is also present in other euro-zone countries, but is less prevalent. Hence the category “operating surplus” in Greece contains a share of income that in other countries would be captured by the more conventional “compensation of labor.”
In blog 8 (August 2021), we commented on the current government’s reported policy plans to subsidize, in various ways, corporations to give them an incentive to merge with other companies, and thus achieve larger scale economies. The absence of large corporations and scale economies was also noted in the Pissaridis report in 2020.
In the reading of the national accounts from the income side, we cannot find evidence that profit levels for companies in Greece are too low (or that wages are too high) and the companies need subsidies to merge. Rather, the competitive forces inside Greece are too weak, and the clientelist control over the government is too strong, to implement truly far-reaching structural reforms and induce much stronger competition in domestic markets—which would present a market-based incentive for mergers and scale economies, instead of a government subsidized incentive. As a result, and for now based on the data that we have, we remain skeptical of this policy incentive. While wages (and pensions) have been cut to achieve more competitive domestic labor markets, subsidizing capital to encourage mergers seems the wrong way to achieve larger companies and economies of scale.
Finally, we can look at the component of GDP that accrues to the government, which is indirect taxes (VAT etc.) minus subsidies. What we see here is also interesting. Consumption based taxes minus subsidies have always been slightly higher in Greece than in the euro-zone partners. There is a good reason for this: consumption as a share of GDP in Greece is often above 90 percent, whereas in the euro-zone it is around 75 percent. Thus, indirect taxes over GDP should be much higher in Greece than in the euro-zone countries average, provided tax efficiency in all countries is more or less the same.
What we see in Figure 1c is that indirect tax receipts were increased accordingly during the adjustment programs since 2010, with a peak during the second Syriza government. The ND government is of the view that taxes in Greece are too high in general, and thus it is cutting taxes, including VAT, corporate taxation, the so-called solidarity tax and the ENFIA tax on house ownership. These cuts are gradually becoming structural.[2] This policy has caused, in part, the widening of the deficits during Covid-19 and pushed the new increase in debt. We are skeptical that this is technically sound, politically durable, and a sustainable policy for Greece as it endeavors gradually to lower debt and converge to the euro-zone average performance. The pressure for tax cuts masks the failure to fully implement effective structural reforms and to make the domestic markets in Greece truly competitive. The distribution of political power thus matters for the functioning of the economy and determines, at the end of the day, the economy’s true potential.
[1] As of mid-2021, the IMF estimates that Greece spent around 13.7 percent of GDP in fiscal support measures in 2020; and is projected to spend around 8.5 percent of GDP in 2021. Numbers for the EU as a whole are still being tallied, but, for comparison, Germany spent around 10.3 percent of GDP in support budgets in 2020; and is projected to spend around 1.7 percent of GDP in 2021.
[2] We do not see evidence that expenditures are cut in a similar structural sense. This will become clearer when the temporary Covid-19 expenses wane.