-
 Greek firms should embrace ESG and DEI despite US-led policy reversal
-
 Podcast - Party time: Greek politics in flux ahead of next elections
-
Podcast - Brain Drain or Brain Regain? Understanding Greece’s Talent Flows
-
 The "King of the North" seeking to heal a fractured kingdom
-
 How inflation has reshaped Greek household spending
-
Podcast - Shockwaves from the Gulf: What the Iran war means for Greece
Where is Odysseus? Part 1 - Demographics

In 2019, one of us wrote a book[1] about the Greek economy called “The Macroeconomy of Greece. Odysseus’ Plan for the Long Journey Back to Debt Sustainability.” This book was published before the Covid Pandemic emerged. It was based on data through 2018.
The book analyzed Greece’s economic trends since 1950 and presented long-run scenarios through 2100 for growth, employment and unemployment, the fiscal position, and Greece’s struggles with public debt. The horizon for the scenarios is long, because policy needs to be sustainable and calibrated for the new generation, which has a life expectancy through 2100.
The book noted that the journey from 185 percent of GDP debt (in 2018) back to below 60 percent of GDP debt would take a long time. Shocks would be part of the journey. Resourcefulness, determination, patience, flexibility, and strategic planning would be required to bring debt levels below 60 percent of GDP. The book’s Odysseus never asks for debt forgiveness, nor is he dependent on others. He is self-starting and has a steady sense of purpose. Odysseus’ own mythical journey depicts these qualities, so the metaphor stuck.
We have advanced in the timeline from the book with three years’ worth of additional data.
A big external shock has arrived, the Covid-19 Pandemic, and a new squall for the Greek economy may be on the way through spillovers from the war in Ukraine.
It is worth asking what happened to Odysseus and his people who set off on their journey in relatively quiet times in 2018. In the next blogs, we would like to update the data and the analytical framework for the trip back to a sustainable Greek economy with much lower debt. It will tell us whether the Greek economy has made progress on its way, or has sustained structural damage from the Covid shock that needs to be repaired.
We will incorporate the three years’ worth of new data and recalibrate the long-run baseline scenario. This will allow us to compare the new path to that of the book of 2019. We can highlight interesting and important differences, and think about their policy implications.
The book recommended that the Greek government present a structurally balanced budget every year, and that it place this budget in a long-run context or scenario. This scenario could then be quantified, discounted to a net present value, and illustrated in an intertemporal balance sheet to show the Greek public what the intention of the long-run plan of the government is. Voters can then make a more informed decision what party they feel is best placed at the helm of the ship to maneuver the country through all the squalls and storms along the way, and achieve sustainability with lower debt.[2] It would be helpful if the Greek government could also present a long-run plan to the public. Rather, more attention now seems to be placed on divining when the next snap election might be, which is regrettable.
There is frequent discussion about how to find “fiscal space” (for spending, as emphasized by the left, or tax cuts, as emphasized by the right). This reflects a search for money to borrow, free money provided by others (EU grants), continued low interest rates (ECB), and how many deposits from households and businesses could be mobilized to boost activity. This is all about spending and increasing aggregate demand. But Greece has never had a problem with spending or a lack of demand. Instead, the constraint is with productivity and insufficient supply.
Throwing lots of money into an economy with slow productivity growth leads to overheating, which has multiple symptoms, including: constant current account deficits in the balance of payments; accumulating debt; and inflation. Today, Greece displays all three of these symptoms. The government tries to manage the problems with help of the European Commission (EC) and the ECB. The EC produces a long-run baseline and debt sustainability analysis. The problem is that the EC long-run outlook invariably has a political element of optimism to it, because it needs to preordain success. We are not aware of hard stress testing of Greece’s outlook to see what could go wrong and what should be the contingency plans.
So, the strategy of the book, and in our updates in the next blogs, is to assess the supply conditions in the economy—how fast can the economy grow in a sustainable way, and what does this mean for the budget to achieve long run debt moderation? If we can find a reasonable approach to these questions, then we can calibrate policies for the wellbeing of the new generation of Greeks who will inherit the debts that current decision makers leave behind.
The size of the economy is measured by real GDP. Real GDP (Q) is the product of labor (L) and labor productivity (Q/L) => Q = L * (Q/L). Labor, or the number of people that work in the economy in the broadest sense (dependent and independent labor, all included), is fundamentally a demographic variable. Labor productivity is a structural variable that depends on the quality of labor, and the availability of capital that labor can work with (productivity is by far the more complicated variable). In this blog and the next, we will first see how demographics impacts the availability of labor (L).
Population. Figure 1 refreshes the population baseline scenario using the pictures presented in the book. It shows the Eurostat population projections from 2011 (through 2060), 2018 (through 2080)(the latter was the latest information available for the book), and the current new update labeled 2022 (through 2100). We can see the impact of the economic crisis of 2010, which led to a reduction in population as birth rates dropped and a rising number of (mostly younger) people emigrated. More recently, some population return and refugees (immigrants) have led to a moderation in the rate of decline in the population.
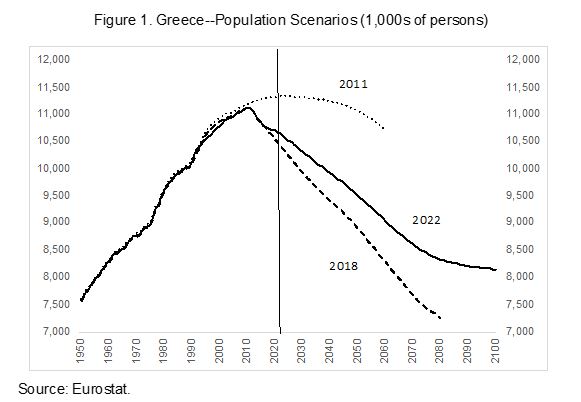
The figure is important, because the size of the population also determines in good part the potential size of the economy. More people means more consumers and also more workers, so both the demand and potential supply sides of the economy are affected. The (structural) growth rate of the economy, going forward, will be slower in the future than in the past. This follows from the decline in the population and in the number of workers in the economy.
Relative to the numbers used in the book in 2019, which were based on the 2018 demographic projections, the Greek population is now expected to be slightly larger, and level off at around 8+ million later this century. Hence, real GDP could be larger than what we thought in the scenarios of the book, and this is potentially helpful with regard to dealing with debt in the economy. At least from this point of view, Odysseus and his people have met with more favorable trade winds than was initially thought in the book.
Working-Age Population. Real GDP is produced by those who work—no matter at what capacity or level they participate in the economy. Thus, we need to go a level deeper and see how many people out of the total population might be able to work. The first step in this exercise is to split the population in three groups: the young, the old, and the “working-age population.” Figure 2 shows the comparison of working-age populations (WAP) in the book (2011 & 2018) and in the new data (2022).
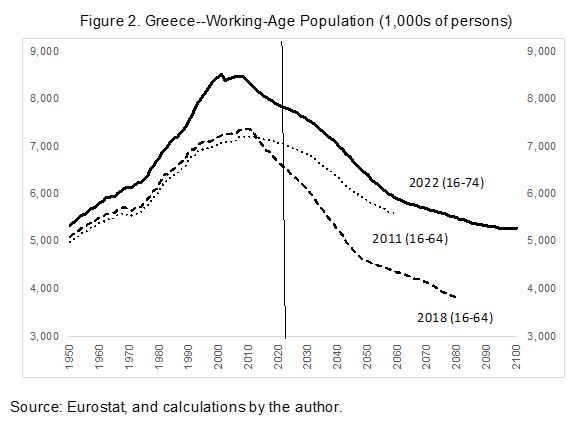
The reader will see that we have made a further change in the calculations, we have redefined the age categories for the WAP. In the past, the WAP was typically defined for persons between 15-65, with <15 being youth and >65 being elderly. But experience shows that people stay healthy longer, and many like to work longer, if they can. Thus, nowadays, OECD countries tend to define the WAP as those between the ages of 15-75. We have now included 2 further cohorts (65-69 and 70-74) in the WAP, compared to previous estimates used in the book.
This broadening of the WAP makes a difference, because the potential number of people that can work is now considered higher than before, as the Figure clearly shows. It does not mean that all the elderly people will actually work, because that also depends on government policies to facilitate their longer work lives. Many countries are actively seeking means to keep people productive longer than before, to help sustain GDP in a shrinking population, and also to alleviate early pressures on the social security systems. One way of doing this is increasing the legal retirement age. Another to curtail early retirement provisions. Greece has already implemented some of these reforms, which is a good development.
Further, what is also important in this Figure is that in all three cases, the WAP has peaked and is now declining. This reinforces the message from the overall population projections that Greece’s demographic transition is moving toward an elderly and smaller population.
In Table 1, we provide a sample of the data and the growth rates associated with each of these time series. The percentage change data are interesting. In the 2011 vintage, the population did not start to ease off until the 2020s, and the decline was gradual. In the 2018 vintage the reduction in the population already started in the 2010s, and the average annual decline of around 0.6 percent is relatively steep. This would certainly slow economic potential. In the 2022 vintage, the decline is still noticeable at around 0.4 percent a year.
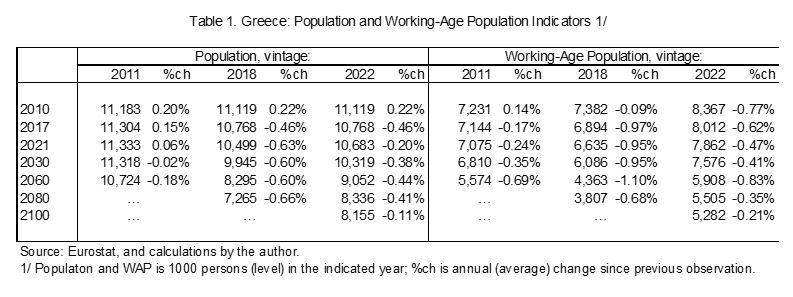
Note that the decline in the working-age population always precedes the decline in the overall population (related to aging). It is also more pronounced than the population changes. In the 2011 vintage, the WAP already declined in the 2010s and would progressively slow. In the 2018 vintage, the WAP dropped sharply by an average of almost 1 percent a year. And even in the 2022 vintage, the drop averages between 0.4 and 0.8 percent a year.
Since labor availability in persons originates in the working-age population, these data strongly suggest that the potential production capacity of Greece will indeed slow in the future. It is very important that any long-run aspirations for the Greek economy consider this demographic constraint. It does not mean that Greece could not perform well, because that depends on per capita real GDP, not the overall size of the economy.
If the population is declining, then growth of headline GDP will slow as well. Politicians should not attack each other because growth slows down. They need to assess the underlying causes of the slowdown, and keep their eyes on per capita developments and overall wellbeing, not headline performance.[3] Unfortunately, the press likes to play up the headline numbers far too much, as though they are important—they are much less important than is commonly thought.
If Odysseus can mobilize policies to increase participation of workers out of a larger definition of the WAP, then Greece can produce a bigger economy than was thought in the original book based on data from 2018. Thus, policy matters. In the next blog, we will look at unemployment and employment. Labor market policies can support a sound participation rate in the economy.
*Bob Traa is a macroeconomist and author of "The Macroeconomy of Greece: Odysseus' Plan for the Long Journey Back to Debt Sustainability" published in 2020. Jens Bastian is senior policy advisor at ELIAMEP.
[1] In Greek, Bob Traa: “το σχέδιο του Οδυσσέα” (Economia Publishing, 2019), or its equivalent in English, Bob Traa: “The Macroeconomy of Greece” (Amazon.com 2020).
[2] Several governments, including in the EU, are producing regular “Long-Run Sustainability Reports,” and they present their budgets in this long-run framework. Frequently, these reports are prepared with the help of independent technical national institutions, subject to expert peer review.
[3] It gets worse. Politicians often think that by pumping up aggregate demand (with public debt), they can boost the economy durably and beyond potential. This is false. It leads to overheating and permanent debt problems. Exactly the features we typically have seen in Greece during the past decades.