-
 Greek firms should embrace ESG and DEI despite US-led policy reversal
-
 Podcast - Party time: Greek politics in flux ahead of next elections
-
Podcast - Brain Drain or Brain Regain? Understanding Greece’s Talent Flows
-
 The "King of the North" seeking to heal a fractured kingdom
-
 How inflation has reshaped Greek household spending
-
Podcast - Shockwaves from the Gulf: What the Iran war means for Greece
Where is Odysseus? Part 3 - Participation

We continue to trace the progress of Odysseus, who started a long voyage in 2018 to help bring Greece home to a sustainable and prosperous economy, seeking to navigate a high debt ratio of 185 percent of GDP towards a debt ratio of 60 percent of GDP. The Plan that Odysseus had developed in 2018 is described in a book on the macroeconomy of Greece.[1]
But, shortly underway, the Covid-19 pandemic emerged, and now the Ukraine war is causing a second external shock to Greece (and the EU). We therefore inquire whether Greece is far off-course from the 2018 path, or whether the recovery looks secure.
In blog 16, we updated the demographic projections for Greece and found that the future population is now expected to be slightly bigger than in the data from 2018. This is favorable for the overall size of the economy. Then, in blog 17, we calculated that the working-age population (WAP), on baseline, is also projected to be bigger than was initially thought in 2018. There are two reasons for this:
- The population overall is larger and,
- Greece is aiming to increase the active working-age population, including encouraging people to work longer before retiring.
Consequently, we expanded the WAP definition from those in the age group 16-64 to those in the age group 16-74, which is now common practice in OECD countries (two additional 5-year cohorts of potential labor resources).
In the current blog, we wish to look specifically into economic participation of those in the working-age population (the “active” population vs the “inactive” population). Figure 1 below sets the stage. The dashed top line 2018 presents the participation rate as it was envisaged with the data through 2018. It takes all people who are employed and unemployed (combined, this is called the labor force) as a percentage of the WAP (16-64). Participation had been rising for some time as females were increasing their participation in the economy and as more elderly workers also stayed on the job longer, facilitated by advances in good health into older age. The 2018 path assumed that participation could increase to 71 percent of the (narrower) WAP.
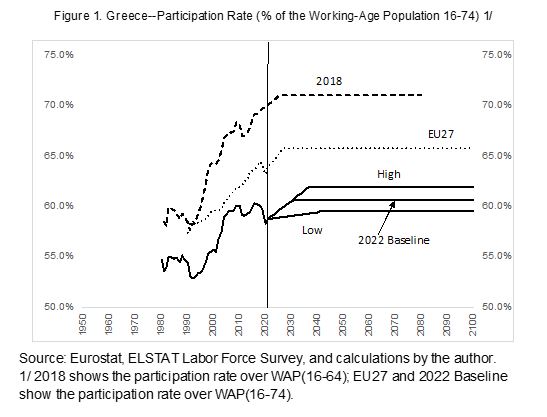
The lower solid line is the participation rate defined over the expanded WAP (16-74). Because the denominator is larger, the ratio of the LF/WAP is naturally smaller in size. We see, furthermore that in the recent past, the participation rate (PR) has tumbled. This was caused by the Covid-19 pandemic, when people tended to leave the labor process in Greece. This phenomenon has also been observed in other countries. The PR is now recovering.
The next question is: how high can the participation rate go? Not everyone of working age can work, but there is room for growth. This is particularly obvious when comparing the PR for Greece with the average PR for the EU27 as a whole (the dotted line in figure 1).
Here we see that the average EU27 PR is around 5 percentage points higher than in Greece. This is quite a large difference, and it has been traced particularly to the lower participation of the elderly (because early retirement has been more common in Greece than in the EU27), and a lower participation rate of females (Southern European countries, not just Greece, share this traditional pattern. The Scandinavian countries have the highest female PRs in the EU27).
It is difficult to make a normative case for participation rates: a higher or lower rate is neither good nor bad in itself. This rate is influenced by preferences. If people place a high value on being with friends and family, instead of spending many hours in a formal labor process, then that is a legitimate choice. However, government policy should then be alert and not assume that the productive potential of the economy (the supply side of GDP) can deliver as large an output as in a similar economy where participation is much higher. Consistency of policy with the potential of the economy is crucial to avoid misfiring and causing a self-induced crisis.
There is another variable that impacts the data. In Greece the tendency for tax avoidance is higher than in some partner countries of the EU27. This could mean that more work is being done in the parallel economy, hence distorting the official data on participation.
And, yet, there is another confusion that is sometimes mentioned in the press. OECD statistics show that the average number of hours worked per employee in Greece is higher than in many other EU27 countries, especially some of the Nordic ones! How can Greek workers working less (lower participation rates) be reconciled with Greek workers working more (OECD hours worked per employee)?
The reconciliation lies exactly in the lower participation of elderly and females in Greece. The Greek LF statistics are heavily weighted toward “prime-age males.” Prime-age males work hard, often more than 40 hours a week. But in countries where the PR is much higher, many women and elderly work part-time and flex jobs (Norway, Finland, Sweden, Denmark, Iceland, Netherlands), which brings their statistics for hours worked per employee down (the OECD statistic). Thus, curiously, these two statistics are consistent.
Greece is now aiming to increase participation. The official retirement age has already been shifted up twice in the last decade. Further, pension reforms toward “personal accounts” or “personal notional accounts” as they are sometimes called, are aimed at incentivizing participation. These are structural improvements in the labor market that will need some time to bear fruit, but they can indeed boost participation.
Greece is also, haltingly, reforming its labor markets, allowing more flexibility in working hours and contracts. Some facilities can specifically support women, such as job-sharing, more daycare facilities, parental leave legislation, etc. Almost all countries experiment with these variables to try and facilitate more females in the labor force. Alas, culture also plays a role and not all countries may be expected to achieve the same female, or elderly, participation rate.
Because of the uncertainties involved, and because we don’t yet know how the labor market will recover from Covid-19 and now the Ukraine War shock, we have formulated three paths for the participation rate in the future (the uncertainty interval). The baseline 2022 foresees a recovery of participation to 60¾ percent of the WAP (16-74). This is above any previous peak. The “high” scenario lifts the PR to 62 percent, and the “low” scenario restrains the recovery of the PR to 59½ percent.[2]
If Greece were to approach the EU27 level of participation in the future, that would materially boost the supply side of the economy and real GDP, but we do not have evidence from the past that this is very likely, and we did not want to impute such a big boom in the scenarios. There is no problem with a variety of participation rates in the EU27, as long as policies in each country are consistent with the preferences of their respective population.
* * *
With the new and somewhat larger numbers in the WAP and the band of participation rates shown above, we can now calculate a cone for the number of people in Greece that may be expected to be in the labor force (LF). This is shown in Figure 2.
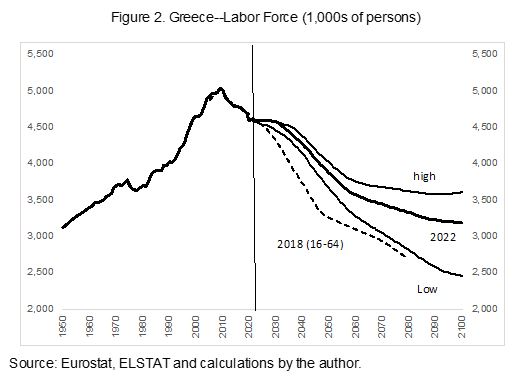
The baseline scenario for the labor force still declines over time, but it sits higher than the baseline that Odysseus had calculated in 2018. Recall, there are two reasons: 1. Slightly higher population and, 2. Slightly bigger WAP with a recovery in participation rates. Also, note that the LF dropped just before the vertical line indicating 2021. This was caused by the reaction to Covid-19, when people dropped out of the labor force. We now also see that the recovery of the PR causes the labor force to remain almost constant for a few years.
After this transition period, the labor force is bound to drop again, as pulled down in the longer run by the demographic anchor. Moreover, it is interesting that even the lower scenario offers a bigger labor force than was thought in the baseline of 2018. This can indeed help Greece generate a higher GDP than was thought in Odysseus’ original plan. However, we need to study labor productivity also (in a future blog), not just the availability of the number of workers in the economy.
* * *
The labor force comprises two groups: those who are employed and have a job or earn an income as independent workers, and those who are unemployed (looking for a job). In the next blog, we will see how we can frame a view on how the economy may transition from the current high unemployment rate to a more “natural unemployment rate” in the steady state.
To continue dealing with uncertainty, we will again place a confidence band around the unemployment rate path, and then around the employment path. Then, we can compare with the outlook available to Odysseus in 2018, and see whether Greece remains on track for a full long-run recovery. The journey thus remains a work in progress.
[1] In Greek, Bob Traa: “το σχέδιο του Οδυσσέα” (Economia Publishing, 2019), or its equivalent in English, Bob Traa: “The Macroeconomy of Greece” (Amazon.com 2020).
[2] Figure 1 shows constant scenarios in the long run, but many analysts show slowly declining participation rates in the long run, because of the continuing process of aging of the population. This restrains PRs.