-
 The World Cup, Argentina and Europe’s quest for moral clarity
-
 Greek firms should embrace ESG and DEI despite US-led policy reversal
-
 Podcast - Party time: Greek politics in flux ahead of next elections
-
Podcast - Brain Drain or Brain Regain? Understanding Greece’s Talent Flows
-
 The "King of the North" seeking to heal a fractured kingdom
-
 How inflation has reshaped Greek household spending
Macroeconomic fundamentals for Greece

Countries can get caught up in the hamster wheel of daily noise. The cyclical ups and downs can become such a fixation that little else makes it onto the radar screen. Citizens then get a sense that the country goes around and round, without anything really changing over time (“…if only we had investment grade…”). Getting stuck in cyclical thinking is a trap.
Greece will have elections soon. The citizens may ascertain what parties can rise above the daily shouting and present a reasoned view of the long run possibilities for Greece. Voters need policies that offer some assurances that excellence in government and sustainability for young generations are considered important. If parties can make policies that are aligned with fundamentals, then much of what goes on as cyclical disturbances will sort themselves out without the government careening from one edge of the pinball machine to another.
Fundamentals in economics are forces and parameters that operate below the surface and may not be directly observable. One needs proxies or a different way of thinking to see them. For instance, in managing the macroeconomy, one may talk about the level and growth rate of potential real GDP. One can also think about underlying slow-motion demographic transitions that structurally affect labor availability. Another is to ask what would be the most likely interest cost as debt is gradually rolled over, from friendly governments holding at a discounted rate to market interest rates. And, what should be the fiscal primary balance that aligns with the need to bring down the towering debt ratio? Keeping an eye on the structural economy that sits underneath the daily messy cyclical economy is important for good policy making.
The business cycle lasts 2-4 years for each substantial swing, and the structural cycle 2-4 decades. The demographic cycle is even longer at around 50 years from growing populations and falling dependency, to falling populations and growing dependency. Where is Greece in the shorter cycle and in the demographic and structural cycle during this decade (2020-2029)?
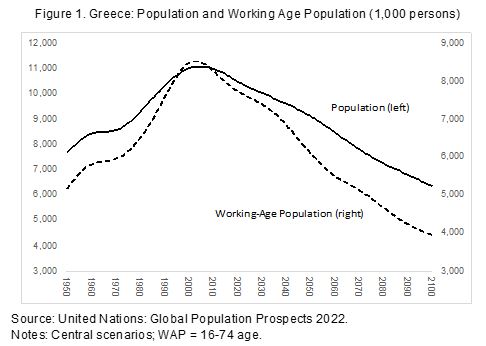
Demographics. To answer this question, let us start with Figure 1. Data are from the UN’s most recent World Population Prospects (central scenario). The demographic cycle is indeed very long. It is a powerful slow-motion force that impacts all countries and economies. Note the different axes; left shows the population numbers, right shows the numbers of the working-age population (WAP), ages 16-74, as in OECD convention for defining the WAP.
The population peaked around 2000, 50 years after WWII. Note also that the WAP increased faster than the overall population before 2000. That reflects “rejuvenation” as many post WWII children (“boomers”) flooded into the working-age. After 2000, we see the reverse. The WAP declines faster than the population, because of “aging” as the cohorts of elderly people are swelling—again a long and powerful slow-motion force.
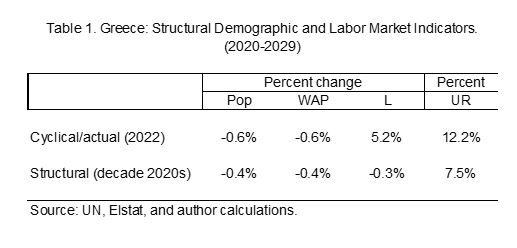
This “big picture” view is the first important indicator for framing expectations of what the Greek macroeconomy can deliver. By 2100, in this UN version, the WAP will be half of what it was in 2000. This anchors how many units of labor Greece can use in its macroeconomic “production function.” In the 2020s, the structural growth rates of the population and the WAP are around -0.4 percent a year (rounded to one decimal).
In a cyclical context, the population and WAP in Greece may have bumps up and down from year to year, for instance if Ukrainians (as refugees) and other foreigners come into the country or leave again. This can produce (heated) discussions on a daily basis whether immigration is good or bad for Greece. Citizens need to be aware, however, that the demographers are of the view that in a fundamental sense, the population of Greece will steadily decline over time.
Labor markets. Let us now turn to the labor market to search for cyclical and fundamental indicators. We will use the quarterly Labor Force Survey from ELSTAT. ELSTAT uses a broader definition of the WAP than the OECD convention. It includes all people over 15 (15+). It does not exclude the elderly. ELSTAT also finds that this broader definition of WAP is also declining at around -0.4 percent a year during the decade of the 2020s—it does not alter the fundamentals.
To lean against the wind of a declining WAP, Greek governments, as elsewhere, have been trying to increase participation in the labor process. This means that policies are designed to bring in more people, including women and the elderly (by reforming the pension system and shifting pension ages up with life expectancy), as active participants into the labor force.
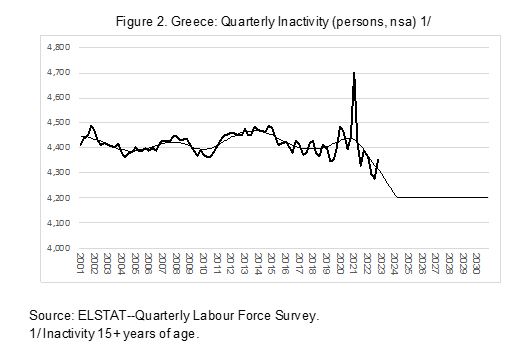
Figure 2 shows that these efforts are yielding some success. The number of inactive people in the WAP (15+) has resumed its decline, after a spike in inactivity during the Covid pandemic in 2020-21. The thin smoothed line in the Figure reflects the assumption that this trend could continue for a while until around the end of 2024.
The reduction of inactivity means an increase in the (active) labor force. Employment can grow faster for a while than is the demographic drag from a falling WAP. Participation within the WAP is rising—a temporary effect. It cannot go on forever, because a core group of people either cannot work or is truly part of the elderly that are retired and do not participate. Government policy, a good employment cycle (encouraging workers), and higher wages, can draw some inactive people back into the labor market, within structural limits.
The fundamental variable underneath this development is the participation rate (PR= LF/WAP). Greece’s PR has always been low compared to other EU countries, fell sharply during Covid in 2021, and is now recovering. Consistent with Figure 2 above, the participation rate is assumed to increase from around 51 percent of the WAP (15+) in the past, to a peak of 53.5 percent by end-2024 (a structural improvement). It seems unlikely that the PR can continue to increase much above this level, which is already high for Greece compared to the past. Further increases are technically possible, but would require additional labor and product-market reforms, which have proven politically difficult. Demographic developments and policies to encourage participation give us a fundamental view on how large the labor force in any country can become (LF = PR*WAP).
The next step concerns the unemployment rate. The labor force (LF) comprises two groups: the employed (L) and the unemployed (U): LF = L + U.
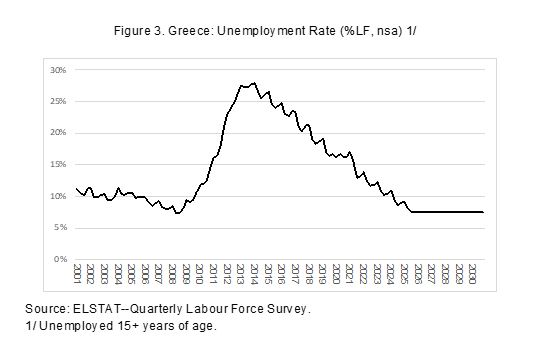
The unemployment rate is a variable that tends to return to a certain value if the economy is at longer term equilibrium—often referred to as the “Natural Rate of Unemployment.” When the cycle is weak (strong) and unemployment high (low), wage demands will tend to ease (increase), which encourages more (less) hiring until the excess (shortfall in) unemployment is absorbed. Greek unemployment has been falling continuously, on trend since 2014, from the deep recession in 2010-2015, and in early 2023 stood at around 11 percent of the labor force.
Figure 3 indicates the assumption that the unemployment rate can fall further to around 7.5 percent (last reached during an overheating economy in 2008 early 2009). This is the estimate we use for Greece’s Natural Rate of Unemployment, reflecting reforms that were made during the crisis in 2010-2015. As already noted, to get this number down further would require deeper labor and product market reforms. Based on this fundamental parameter for unemployment, and given the momentum to lower unemployment levels in the recovering economy, it would appear as though Greece could see further progress in bringing down the unemployment rate through 2025, before structural limitations become binding.
Now that we have a view on structural unemployment and the size of the labor force, we can calculate how many units of labor (L) Greece can deliver in the economy (Figure 4). This Figure shows the recovery from the deep recession, and, by extension, the expectation that, on current trend, this difficult long episode will likely be completed approximately by 2025. The recovery that we see in the economy is an extended cyclical recovery, with some structural improvements from the reforms undertaken during the crisis. By 2024-26, we anticipate that the underlying fundamental factors in the population and the economy will start exerting their gravitational pull on headline growth, employment, and fiscal numbers, again.
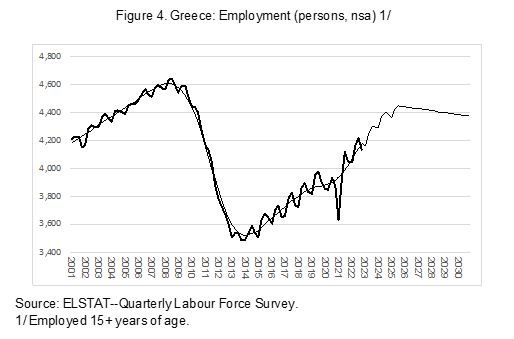
The underlying structural or fundamental drag on employment growth, from the demographic profile, is estimated at -0.3 percent a year for the decade of the 2020s (Table 1). Until around 2025, the cyclical recovery is overriding the demographic anchor by pulling new labor resources into active participation in combination with a significant lowering of the pool of the unemployed (Covid temporarily intervened in 2020-21). The overall ongoing recovery process has allowed Greece to grow soundly, despite the demographic anchor. The steady recovery has been a welcome relief from the 2010 crisis and the pandemic.
National accounts. Now that we have a view on demographics and labor market dynamics, we can develop a view of potential real and nominal GDP growth. Real GDP (Q) is the product of two variables, the number of persons working in the economy (L) and their efficiency at work, or average labor productivity (Q/L). Thus, Q = L * (Q/L). We have developed a view on L, both its recovery cyclical impact and the structural outlook. We must now consider average labor productivity in Greece to complete our structural view on potential real GDP growth.
Average labor productivity growth in Greece rose to about 1.5 percent a year in the boom decade of the 2000s. However, this was boosted by temporary effects, such as coming into the euro zone; a sharp cut in risk premia on interest rates in Greece triggering massive borrowing; and a wage boom that propelled aggregate demand while harming competitiveness. Thus, the boom proved unsustainable, as the crisis of 2010 demonstrated. In the crisis decade, average labor productivity was negative on trend. It has only in 2022 shown new life as productivity growth became positive again with the sharp growth rebound after the Corona pandemic.
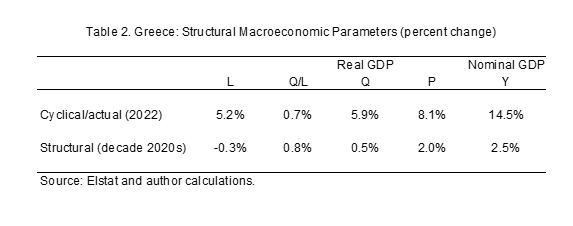
As Table 2 demonstrates, because of unusual shocks to the economy in recent years, the cyclical indicators show movements in the economy that are temporarily quite distant from longer run fundamental factors. If we combine the structural factors of negative potential labor growth with a recovery of structural average labor productivity growth to 0.8 percent a year (the average in 1990-2022 was 0.7 percent), then we arrive at potential real GDP growth of 0.5 percent a year in the steady state (expected to emerge in the second half of the 2020s, after the excess pool of the unemployed has been absorbed). With inflation of 2 percent (ECB target), this would yield a structural nominal GDP growth rate of around 2.5 percent a year.
The unusual cycle at this moment makes it difficult for the public, and perhaps the political system, to see what the underlying fundamental parameters and forces in the economy are. This carries risks, because expectations can get misaligned, and promises in the current electoral cycle may be(come) too generous.
Fiscal policy. With the cyclical and structural macroeconomic framework of population, labor, GDP, and prices presented above, we can now assess what this implies for fiscal policy. The results for the overall fiscal balance of the general government and gross debt (Maastricht definitions) by end-2022 have not yet been published. Based on various sources and partial information from the Ministry of Finance, Central Bank of Greece, European Commission, and ELSTAT, we anticipate a debt ratio of around 175 percent of GDP; a fiscal balance of around minus 3 percent; the interest bill around 2½ percent, and the primary balance around minus ½ percent of GDP (Table 3). This would reflect a notable improvement over 2021 as the costs of the pandemic are abating, and the high inflation tax is temporarily boosting the fiscal outcome.
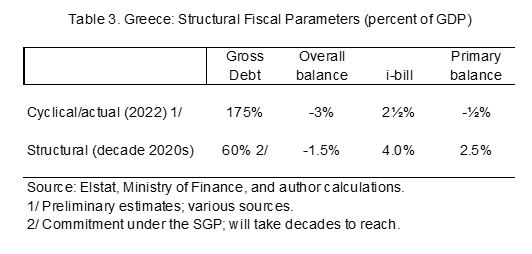
Estimates for the structural, or underlying fundamental fiscal position are presented in the second row of Table 3. Greece as a member of the euro area is committed to bringing the debt ratio down over time to 60 percent of GDP or below. If structural nominal GDP growth is estimated at 2.5 percent a year, then the tolerable Maastricht deficit for Greece that is consistent with this debt commitment amounts to maximum 1.5 percent of GDP.[1]
Greece receives a large interest subsidy every year on its debt, which is mostly held by EU partner countries at low fixed rates. Over time, this debt will roll over on market terms. New debt has been placed recently requiring 4 percent interest, and above. This rate applies for now only to a small portion of the overall debt, which will be growing. We estimate for now an underlying structural interest bill of 4 percent of GDP in this decade. If interest rates do not come down again, this cost will grow further as the proportion of market-placed debt grows.
Finally, we can estimate that Greece needs a structural primary surplus of at least 2.5 percent of GDP in the decade of the 2020s, to be consistent with commitments made under the EU’s Growth and Stability Pact. Ideally, this primary balance is in place by around 2025, because we suspect that the long recovery from the great recession of 2010-2015 will then be completed, and when Greece returns to its structural underlying growth potential.
Conclusions
- Greece is in a long recovery from the deep recession of 2010-2015
- This recovery is on track to be completed, with current dynamics, by 2024-25
- The growth performance will then again become subject to the demographic anchor on labor availability, and, as expected, a return to moderate labor productivity growth
- To make Greece’s fiscal commitments consistent with the underlying fundamental capacity, we estimate that Greece should aim for a primary fiscal surplus of at least 2.5 percent of GDP (barring new shocks or setbacks)
- The risk is that in an electoral cycle - Greece is due to hold elections on May 21 - the political system will make too-optimistic promises, creating misaligned expectations among the public of what the economy can deliver in the future. Current upside surprises in growth, employment, and fiscal results are not a “new normal.” Policy should be calibrated sustainably on underlying structural characteristics and parameters of the economy, not on the latest cyclical developments.
[1] This calculation follows a Euler Equation for motion in the debt ratio. In the limit, the debt ratio (D) will approach, asymptotically, the ratio of the average budget deficit (def) and the nominal GDP growth rate (Ẏ). Thus, D = def/Ẏ. The Maastricht Criteria of 60 percent of GDP debt and 3 percent deficit are based on the same formula, with nominal growth of 5 percent in GDP (from 1992, when the Maastricht Treaty was negotiated—2 percent inflation and 3 percent real GDP growth): 60% = 3/5.