-
 The "King of the North" seeking to heal a fractured kingdom
-
 How inflation has reshaped Greek household spending
-
 Podcast - Shockwaves from the Gulf: What the Iran war means for Greece
-
 Energy crisis puts squeeze on Greek fiscal policy
-
Podcast - Kaisariani photos: Why Greece’s past is present
-
 Is the Greek green transition running out of power?
Where is Odysseus? Part 4 - Unemployment and Employment

As in the previous three monthly blogs, we continue to trace the progress of modern-day Odysseus, who started a long voyage in 2018 to help bring Greece back home to a sustainable and prosperous economy. He is seeking to navigate a high debt ratio of 185 percent of GDP towards a debt ratio of 60 percent of GDP. The Plan that Odysseus had developed in 2018 is described in a book on the macroeconomy of Greece.[1]
In blog 16, we updated the demographic projections for Greece and found that the future population is still expected to decline, but to be slightly bigger than in the data from 2018. In blog 17, we calculated that the working-age population, on baseline, is also projected to be bigger than was initially thought in 2018. In blog 18, we calculated the labor force out of the working-age population. Again, we found a larger labor force than was assumed in 2018, in the baseline, and in the low and high scenarios. These demographic updates can favor the recovery of Greece and could assist Odysseus’ 2018 plan to achieve a sustainable economy.
In this new blog, we will look at the last link in the demographic chain: Dealing with the potential supply of labor resources in the economy. The labor force calculated in blog 18 comprises two groups: those who are employed and have a job or earn an income as independent workers, and those who are unemployed (looking for a job): LF = E + U. Since we have a path for the labor force, we need to split this number in two groups: E and U.
We can first consider how the economy may transition from today’s high (cyclical) unemployment rate to a more “natural (structural) unemployment rate” in the steady state. Once we have a path for unemployment, the path for employment then results automatically from E = LF - U.
Labor markets have a kind of automatic stabilizer built in. When unemployment goes up very high, the surplus of unemployed people will start taking jobs at lower wages, thereby making the economy as a whole less expensive and thus more competitive. This attracts investment and provides incentives to hire more labor. As a result, unemployment will ease off again from its peak. Similarly, when the economy runs hot and unemployment drops to a low level, a shortage of unemployed workers will lead to higher wage demands, which hurts competitiveness and lowers investment, hence lifting unemployment up again. Every economy, when left to its own devices, will normally cycle around an unemployment rate that is fairly steady in the longer run. This steady-state unemployment rate is called the “natural rate of unemployment,” or the “non-accelerating inflation rate of unemployment (NAIRU).
Cyclical variation in economic activity generates the contemporaneous unemployment rate--low when the economy is “hot” and high when the economy is “cold.” But what determines the natural rate of unemployment (a longer run average)? This is a structural variable. It is determined by structural factors in the labor markets and the economy. For instance, if the labor market is very flexible and the workforce can easily be adjusted up or down, then workers and their labor unions will be cautious with labor cost demands, and the natural rate will be somewhat lower.[2]
Similarly, the ability to tailor the work week or working hours and working conditions (i.e. flexible labor contracts) to many different groups of workers, such as women (incl. offering day care), minorities, and elderly workers, will also tend to lower the natural unemployment rate. In general, “protecting labor” can result in higher wages but lower employment in the steady state. Political sentiment, as expressed in labor market regulation, is thus a determining factor in achieving a long-run steady state and natural unemployment rate. The EU tends to have a high average unemployment rate, compared to the US, but over the years, many EU countries have reformed their labor legislation and now the natural rate in Europe is slowly declining from its previous averages.
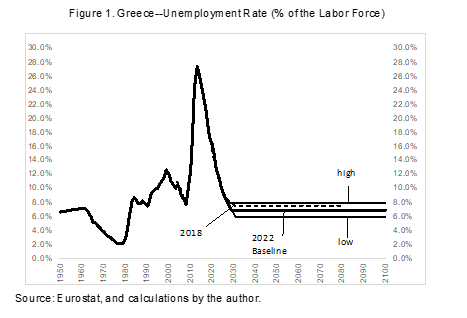
How does this look in Greece? Figure 1 above gives a view. The average unemployment rate (UR) in Greece in the period 1950-2021 was 9.4 percent. The trend in the past had been slowly increasing. The crisis in the 2010s shot the UR to a peak of 27.5 percent in November 2014. Then, with lots of effort and very difficult negotiations during the programs with the EC/ECB/ESM/IMF labor market legislation was revised and wage demands were curtailed, resulting in a recovery of Greece to lower, but still appreciable, unemployment rates. The recovery has not yet played out and there is more distance to travel. The monthly unemployment rate for Greece stood at 12.5 percent in April 2022 (Hellenic Statistical Agency).
How low can unemployment go? We hypothesized in 2018 that the natural UR could settle around 7½ percent of the labor force. Employment growth has since been robust, even during the Covid episode, so we now take this down, as a baseline hypothesis to 7 percent. That is considerably lower than in Greece’s past, and reflects the efforts made during the crisis years.
One could ask why Greece wound up with such a sky-high unemployment rate during the crisis, in the first place. Discussions with labor groups prior to the crisis revealed one very interesting misunderstanding that influenced labor bargaining in the past. Greece had been on the drachma before adopting the euro in 2000. Domestic inflation was always higher than foreign
inflation, and the drachma was devalued several times in the past to preserve competitiveness of the Greek economy vis-à-vis its important trading partners in the EU. Once the euro was adopted, Greece could no longer devalue. But inflation continued to be higher than in trading partners by an average of around 1 percentage point throughout the first 10 years of the euro adoption. This deteriorated competitiveness and caused an erosion of investment and underlying strength and resilience in the economy and the labor markets.
In discussions with labor unions and other labor groups, it was revealed that unions aimed to preserve at least constant real wages over time, measured with domestic inflation. The misunderstanding in this view was that when one is in a currency union, domestic inflation is no longer the relevant indicator for “real wages.” Rather, it is the average price index and average inflation of trading partners that becomes the relevant indicator for real wages. Since foreign inflation was lower than in Greece, by insisting on compensation for domestic inflation, the unions and government policy slowly but surely sawed the legs from under the chair that the factor labor was sitting on. Greece became uncompetitive as wages were rising faster than prices in partner countries, leading to growing external balance of payments deficits. This sapped, over time, the strength of the Greek economy until it collapsed in the crisis of 2010.
Informed by the painful experience of the 2010 crisis, Greece has now come a long way from this original mistake as a member of the euro zone, and inflation in Greece should remain below that of trading partners, at least until the excess labor has found employment. There are some red flags that are going up now because Greek inflation is once again rising above the euro zone average. This should not continue because Greece has not yet fully restored competitiveness. This is also evident by the persistent external current account deficit, despite moderate growth in Greece in recent years, and under-utilization of labor availability.
At the same time, one wonders whether Greece has overdone the fiscal stimulus and aggregate demand support during the Covid episode? Demand policy has been expansionary, but what happened to supply conditions? Structural reforms in labor markets and product markets remain essential to cement the gains made during the economic crisis of the 2010s. Still, for now, we assume that the natural UR may settle at 7 percent. To deal with uncertainty, we have also calculated the effects if the natural UR instead settles at 8 percent (high UR) or 6 percent (low UR). These parameters define the uncertainty band for the natural unemployment rate in the updated path for Odysseus.
Now that we have three scenarios for the size of the labor force and three scenarios for the size of the natural rate of unemployment, we can calculate three scenarios for the potential level of employment in Greece’s long run. For the baseline, we will combine the baseline estimate of the LF with the baseline estimate for the UR. For the low employment scenario, we will take the low scenario for the size of the LF and the high scenario for the UR. For the high employment scenario, we will take the high level of the LF and the low UR. Thus, we will have a low and high employment path, with the baseline in between. All other combinations for employment will be between the low and high scenarios, as indicated in Figure 2.
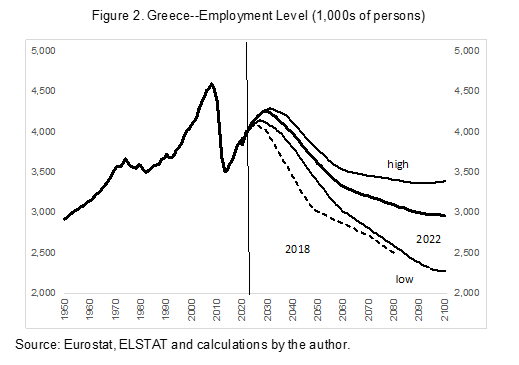
The calculations show that the potential paths for employment sit above the original path for employment calculated in Odysseus’ Plan based on data from 2018. Once again, we see that demographics provides the anchor for labor availability. At the same time, a drop in employment in the future, after the current recovery, is virtually assured. As the population declines in the future, employment is also expected to fall, and economic growth will decline.
Summarizing, we are left with some important questions:
- Why is inflation in Greece again above the EU average, despite a weak economy?
- Do the readers agree that the natural rate of unemployment could settle at 7 percent, or is this too optimistic?
- Has fiscal support for the economy been overdone during the Covid-19 pandemic and (energy) price inflation resulting from Russia’s invasion of Ukraine? Why has it been larger in Greece than in the average EU, despite Greece’s already sky-high debt burden?
- Policy in Greece emphasizes aggregate demand. What evidence do we have that aggregate supply is also structurally improving?
We are still one step away from calculating the new path for potential real GDP. We need to combine the availability of labor, above, with the skill or efficiency of future labor resources. This skill is called average labor productivity--or, how many units of real GDP can an average employee in Greece generate? This is a structural supply indicator. That will be the topic of the next blog. And, once again, we can compare our new calculations with the path that was envisaged in the book of 2018.
[1] Bob Traa: “το σχέδιο του Οδυσσέα” (Economia Publishing, 2019), or its equivalent in English, Bob Traa: “The Macroeconomy of Greece” (Amazon.com 2020).
[2] For instance, labor markets in the US tend to be more flexible than in the European Union, where labor protection is more pronounced. The result is that the US has a lower average unemployment rate than the EU.