-
 Greek firms should embrace ESG and DEI despite US-led policy reversal
-
 Podcast - Party time: Greek politics in flux ahead of next elections
-
Podcast - Brain Drain or Brain Regain? Understanding Greece’s Talent Flows
-
 The "King of the North" seeking to heal a fractured kingdom
-
 How inflation has reshaped Greek household spending
-
Podcast - Shockwaves from the Gulf: What the Iran war means for Greece
Where is Odysseus? Part 5 - Productivity

As in our previous four monthly blogs, we continue to trace the progress of modern-day Odysseus, who started a long voyage in 2018 to help bring Greece back home to a sustainable and prosperous economy. He is seeking to navigate the winds of a high debt ratio of 185 percent of GDP towards a debt ratio of 60 percent of GDP. The Plan that Odysseus had developed in 2018 is described in a book on the macroeconomy of Greece.[1]
In blog 16, we updated Greece’s demographic projections and found that the future population is expected to be slightly bigger than in the data from 2018. Consequently, in blog 17, the working-age population, on baseline, was also projected to be bigger than initially thought in 2018. In blog 18, we found a slightly larger labor force than was assumed in 2018. Finally, in blog 19, the assumption that unemployment could drift down to 7 percent of the labor force allows employment to grow for a while, until the demographic anchor sets limits on further labor supply growth. Thus, compared to the outlook in 2018, Greece may expect somewhat higher employment levels, in persons, than was anticipated in Odysseus’ original navigation plan. These demographic updates favor a somewhat longer and bigger recovery of Greece.
Alas, in this blog we will show that there is a glitch. While demographic updates have been favorable, the productivity developments since 2018 are disappointing. Real GDP per employee in Greece is growing less quickly than in Odysseus’ Plan of 2018. Productivity is the ultimate supply and competitiveness indicator for a macroeconomy: how efficient are the workers in a country to produce real GDP? After all, productivity determines per-capita income. We will demonstrate our findings in a series of graphs. As we dig deeper into the inner workings of the economy, more data is being processed, thereby capturing the essence of what we find is more easily transmitted in graphs than in lengthy complex tables.
Employment. Consider Figure 1, below. This shows an index (2000Q4=100) of annual average employment (persons), based on the Labor Force Survey by ELSTAT. The jobs crisis after 2009 is evident, as is the Covid-19 shock in 2020-2021 (the solid line). We don’t want to let the Covid-19 episode define employment on the downside, so we have completed the time series by positing that real GDP growth in 2022 and 2023 is 3.8 and 3.5 percent, respectively, and that unemployment drops further to 12.9 and 11.6 percent in 2022 and 2023, respectively. This gives 5.3 percent cumulative employment growth over 2022 and 2023, which is substantial.[2]
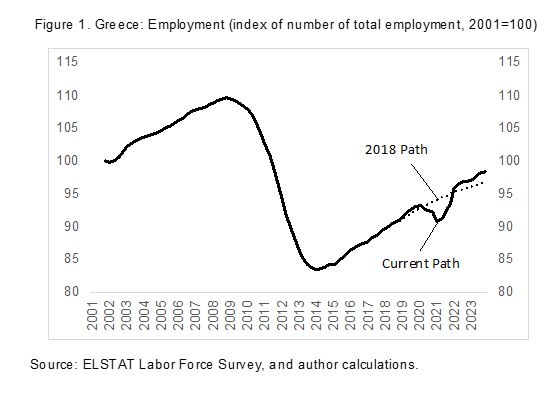
The dotted line in Figure 1 shows the employment path that was anticipated in Odysseus’ 2018 Plan. We see that the Covid-19 downturn was unanticipated, but has been followed by a remarkable recovery in employment—exactly as the European Union, and Greece, have aimed to achieve. It has been explicit policy in Europe to protect jobs from the external Covid shock.
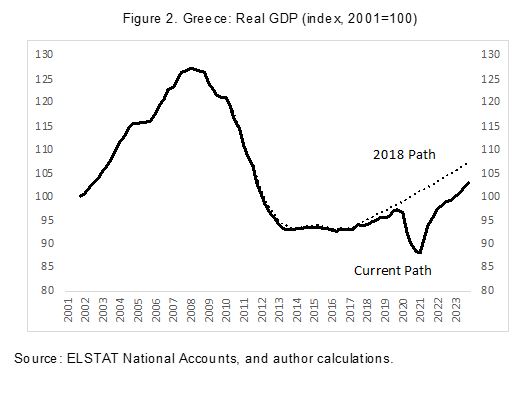
Real GDP. Now we need a picture of real GDP, which is presented in Figure 2. Again, we show the current path as the solid line, and the one foreseen in Odysseus’ Plan as the dotted line. The crisis after 2009 and the Covid-19 recession are again prominent. The recovery in 2021-2023 brings real GDP back to the path it was on before Covid. Note that as of 2018, already the real GDP path fell slightly short of Odysseus’ Plan; this gap seems to have been extended, even after recovering from the Covid-19 recession. “Seeing through the Covid-19 recession” for underlying structural growth potential, actual real GDP is on a slower path than was envisaged in 2018, even though employment has risen above the path foreseen in that Plan.
Productivity. Now that we have employment, in persons, and real GDP through 2023, we can calculate the path for real GDP per person employed. That is average labor productivity. Figure 3 presents the result. Relative to the 2018 Plan, employment has grown somewhat faster, and real GDP has grown somewhat slower than was envisaged. This means that productivity (real GDP/employment) has fallen behind the 2018 Path that was envisaged.
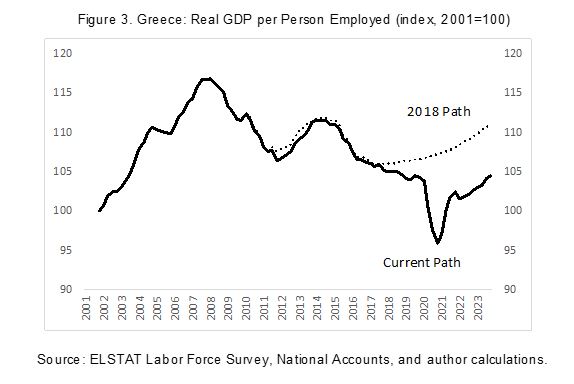
We may summarize that the compounded growth rate of productivity, as envisaged in the 2018 path for the period 2001-2023 was 0.47 percent a year. The current estimate of productivity growth for this period is 0.19 percent (less than half Odysseus’ objective). The marginal growth rate of productivity that Odysseus had foreseen after 2018 was a recovery to 1.5 percent a year. The actual realized productivity growth rate in recent years has been slightly negative since 2018. Of course, this reflects the collapse in 2020 and a recovery since then.
So, productivity growth has faltered and is yet to recover its vitality as envisaged in the Plan of 2018. The gap between aspiration in 2018 and reality, through 2023, has thus widened. Greece has essentially opted to support employment while trading off productivity growth. It has not managed to do both, which is the gold standard—achieving both employment and productivity growth at the same time for healthy long-run prospects.
As a result of this new reality, we adjust the aspirational path of 2018 for Greece’s long-run productivity growth, from 1.5 percent a year on average to 1 percent on average (this assumes that an improvement will still come). We may now label the previous aspirational objective for productivity growth as the “high” scenario, and the “low” scenario may be placed, symmetrically, as 0.5 percent growth a year. The baseline is then the path in the middle at 1 percent growth a year, as shown for the long run, and using annual data, in Figure 4.
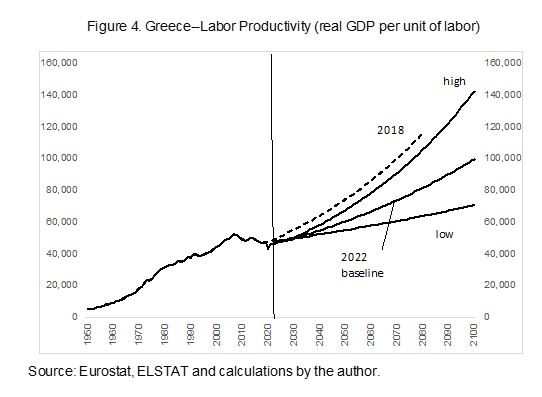
The reader may see that the loss of productivity during the Covid-19 recession and policies followed since 2018 to date have somewhat depressed the path for the future as a whole. The “high” scenario is parallel to Odysseus’ Plan because they both advance productivity at 1.5 percent a year. The updated baseline shows a smaller slope because reflecting growth of 1 percent a year. In the event that productivity does not recover, the low path may prevail at 0.5 percent a year. Since productivity determines per-capita income, the different possible outcomes in the long-run will determine the standard of living of citizens in Greece. Supply conditions, efficiency, and competitiveness of the economy hinge crucially on productivity (growth) in the long run.
Source of employment. Finally, we can ask the data if they offer clues where the high growth in employment is coming from, despite scant real GDP progress over time, on average. The allocation of employment in the different sectors of the economy is important, after all, since productivity levels differ by sector. Notably, the public sector tends to have low productivity (in most countries), whereas the private sector tends to have higher productivity.[3] Thus, if one wants a fast growing economy with good productivity growth, then it is in the interest of the country to allocate more people to the private sector, in comparison to the government sector.
Figure 5 presents the data for Greece.
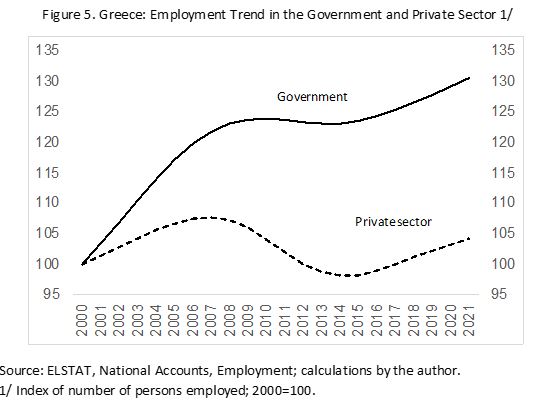
The figure shows an index, 2000=100, of employment in government and in the private sector, drawn from the national accounts presented by ELSTAT. The episodes of jobs growth and retrenchment reflect the economic cycle in Greece. It is remarkable that the government, in 2021, employed 30 percent more people than in 2000; the private sector employed 5 percent more people than in 2000. Real GDP in 2000 was 181 billion euros; real GDP in 2021 also reached 181 billion euros. So there was no final growth in real GDP over this two-decade interval.
Thus, the relative labor allocation in Greece is toward the government, especially during the terms in office of the conservative party (ND). This contrasts with the usual platforms of conservative parties that advocate “more private sector, less government.” What the latter evidently means is not “less government employment”, but instead only “lower taxes.”
So, how is the employment boom paid for? In fact, with public debt. The debt ballooned during the period 2000-2009, then the crisis came toward balanced budgets through the end of the Syriza government. Beginning in 2019, taxes were cut and deficits started up again, as well as a new round of increases in the debt (already before Covid was discovered). The bill for higher government employment comes at the cost of lower productivity for the country as a whole, and more debt on the intertemporal public sector credit card for the children and grandchildren in contemporary Greece.
Plus ça change, plus c'est la même chose
*Bob Traa is a macroeconomist and author of "The Macroeconomy of Greece: Odysseus' Plan for the Long Journey Back to Debt Sustainability" published in 2020. Jens Bastian is senior policy advisor at ELIAMEP.
[1] Bob Traa: “το σχέδιο του Οδυσσέα” (Economia Publishing, 2019), or its equivalent in English, Bob Traa: “The Macroeconomy of Greece” (Amazon.com 2020).
[2] As we write these blogs, new shocks are hitting Greece and the world economy, so these assumptions may be too optimistic—we will see. In any event, we didn’t want to bias the results with pessimism, as economies can, and do, rebound, when events settle down into more tranquil times. In June 2022, the Greek Central bank revised its baseline growth projection for 2022 downward to 3.2 percent from 3.8 percent.
[3] Real gross value added per employed person (ref. prices 2015, National Accounts), declined by 17.2 percent in the public sector between 2000 and 2021; it dropped by 4.8 percent in the private sector during this interval.